Insights+ | JAS'22
Navigation Panel
Problem Statement:
The current landing page of Insights+, reports listing page has all reports listed without any proper grouping and structure.
The users find it difficult and tiresome to everytime search for the reports that they wish to see
Lack of structure in the listing page tends to discourage the users to find meaningful usage of Insights+ and leads to transactional engagement at best
Landing Page of Insights+ lacks standardization which could have led to greater ease of use
Use Cases:
Below are the use cases :
- As a user you would want to discover and access your reports easily
- View your Standard Reports upfront with minimal efforts.
- Easily identify your product - wise reports.
- Smoothly navigate across all the modules of the Insights+
- Discover reports/charts containing specific KPI/s
Solution:
On the Landing page of Insights+, we have a Navigation Panel on the left side of the screen. The Navigation Panel will help you to traverse smoothly across the different modules of the product. The panel ensures better accessibility and discoverability of Reports .
Navigation Panel has following features and flows:
- Users can view and navigate to all the sections of the product via the Navigation Panel.
- The reports are grouped under different categories in the navigation panel.
- For each of the products namely Engage+ , Loyalty+ , CDP and SmartStore+ , the Standard reports are listed in the Navigation Panel upfront.
- Users can scroll through the list of Standard reports and click on the report names to Navigate to the particular report.
- To view the list of custom reports, the user can simply click on the custom report tab in the Navigation Panel.
- Users can also navigate to the reports created by him/her and the ones marked as favorite via the Navigation Panel
- The sub - sections of the different modules of the product are listed upfront and one can directly navigate to that page/section.
- Users can filter out the list of reports/charts which contain a certain KPI/s via the filter provided on the landing page
.gif")
For more detailed information,visit the article : Product Navigation
One Click view of Loyalty Performance Reports
On the current Loyalty UI, users aka Loyalty CRM Managers, Product teams and any external or internal members using Capillary’s Loyalty+, have only a view of the Loyalty Program Set Up including the Tiers, Reward Currency, Communications, Expiry details etc.
To understand how these programs are performing and periodically measure and understand the KPIs, they had to follow a step by step process to reach Capillary’s analytics Product - Insights+. Taking cognizance of this multi-step access, we have improved it for users to have a nimble approach to checking the performance and KPI.
This step by step process has now been reduced to a single click process. Now you can quickly access the specific critical Reports of your Loyalty Programs with 1-Click.
Problem statement
- User’s path to access to specific critical report on Insights+ from Loyalty+ has been multi-step process causing users to lose motivation on the way.
- Measuring engagement and understanding user’s intent on Loyalty+ could not be fully ascertained.
Use cases
- User should be able to access specific reports on Insights in 1 click
- User should be able to view the specific reports opened on a separate tab so that context of Loyalty UI is maintained
Solution
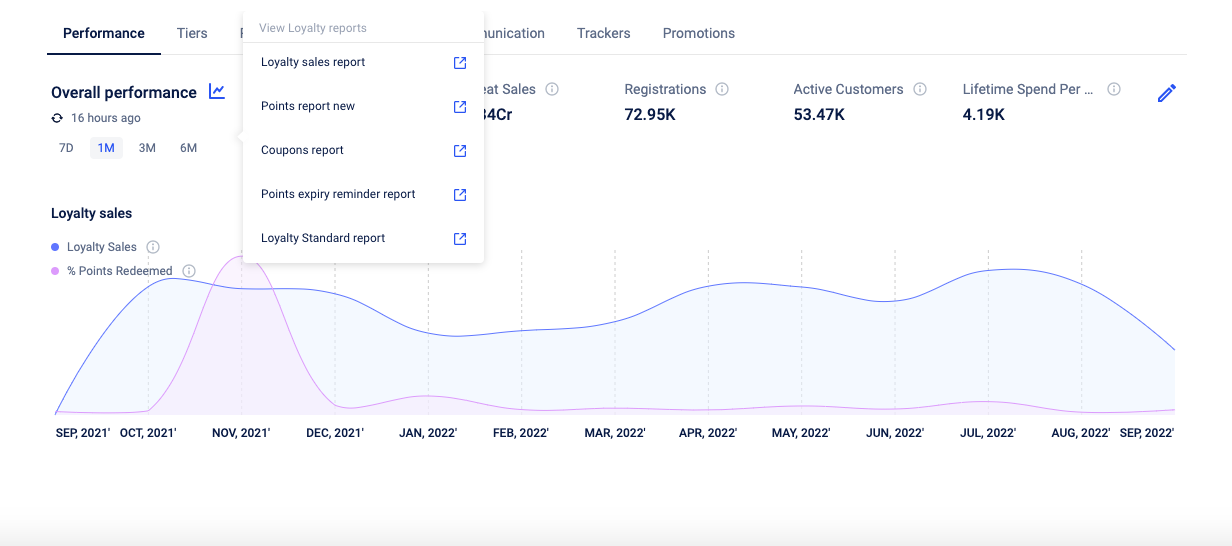
- Specific reports links have been put upfront on the Home page of Loyalty+ UI
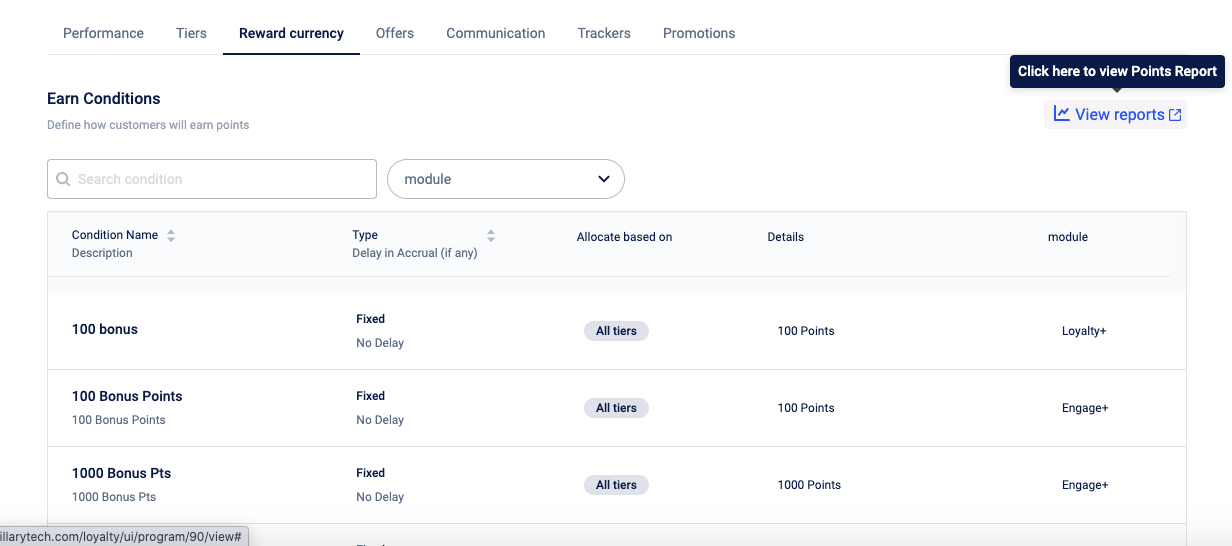
- Each Section as below has been tied up with relevant report which can be accessed by clicking on “View Reports” link on the respective tab
(I) Following are the mappings:- Overall Performance: Top 5 reports
- Loyalty Sales Report
- Points Report
- Coupons Report
- Points Expiry Reminder
- Loyalty Standard Report
- Overall Performance: Top 5 reports
| Loyalty Feature Tab | Associated Report | Purpose |
|---|---|---|
| Tiers | Loyalty Standard Report | To view overall KPIs for each of the tiers and overall loyalty base performance |
| Reward Currency | Points Report | To view Points allocation and redemption related KPIs |
| Offers | Coupons Report | To view Coupons issuance and consumption KPIs |
| Communication | Loyalty Standard Report | To view overall performance of Loyalty Base across strategic KPIs |
| Points Expiry Section | Points Expiry Report | To view overall KPIs related Points Expiry and reminders |
Segmentation at OU Level
Purpose
- For Orgs with multiple OUs, EI doesn’t support segment creation at an OU level.
For eg :-To create a segment of customers who have 30 days in Watson and have spent more than AED 300 in Watson. (Watson is one of the 27 OU’s of Brand XYZ), if we follow the conditions approach, the conditions would be applied to all the customers of that org and not just ‘Watson’ OU.
Use cases:
- User should be able to select whether to create segments at Org level or OU level
- Users should be able to create customer segments at OU level.
Sample case: If an org has 5 OUs , the user should be able to create segments for a particular OU only. The segment created should not reflect in any other OU of that org. - Users should be able to create segments at Org level.
Solution:
Selecting OU or Org Level Segmentation
- The user can select from the Organizational dropdown above the organization or OU for which he wants to create the segment.
- If he selects an Organization, then the segment created will be at organization level.
- In case he selects an OU, the segment created will be for that particular OU only.
OU Level Segmentation
- When segments are created via ‘conditions‘, the conditions are applied to the customers who have transacted in that OUs only.
- The created segment is available/visible in the segments list of the concerned OU only and not at the org level or any other OUs
-ie when the user selects the org name (not any specific OU) in the ‘Select Organization’ drop down, the segment is not visible
-when the user selects the concerned OU in the ‘Select Organization’ drop down, the segment is visible.
NOTE:
- OU Level segmentation is applicable only for the transactional KPIs and not on the behavioral KPIs of the customer as of now.
Here :
Transactional KPIs → KPIs which are can be tied to the transaction till of the customer ( eg: Total bill amount)
Demographic KPIs → KPIs which are based on the demography of the customer and not on the transaction (eg: Wedding date or Date of Birth) - Below is the list of Transactional and Behavioral KPIs of Customer summary based on which the user can create the conditions for Segmentation.
| Customer Summary KPIs | Type |
|---|---|
| conversion_date | Demographic |
| Date | Demographic |
| dob | Demographic |
| wedding_date | Demographic |
| joined_date | Demographic |
| Redeemed Points | Transactional |
| First Visit Basket Size | Transactional |
| Number Of Visit Days | Transactional |
| Returned Bill Amount | Transactional |
| Loyalty Points | Transactional |
| Expired Points | Transactional |
| First Visit Bill Amount | Transactional |
| Average Spent Per Visit | Transactional |
| Redeemed Voucher Count | Transactional |
| Lifetime Points | Transactional |
| Number Of Visits | Transactional |
| Lifetime Purchased | Transactional |
| Sku Purchased | Transactional |
| Average Spent Per Sku | Transactional |
| Returned Bill Count | Transactional |
| Total Bill Amount | Transactional |
| Total Line Item Amount | Transactional |
| Total Returned Line Item Amount | Transactional |
| Total Bill Count | Transactional |
| Skus Returned | Transactional |
| Line Item Count | Transactional |
| Latency | Transactional |
| Last Visit Bill Amount | Transactional |
| Max Bill Amount | Transactional |
| Max Bill Count In Week | Transactional |
| Max Bill Count In Day | Transactional |
| Redeemed Visit Days | Transactional |
| Redemption Latency | Transactional |
| Redeemed Visits | Transactional |
| Points Awarded Days | Transactional |
| Redeemed Rate | Transactional |
| Total Points Redeemed | Transactional |
| Has Spike Bill | Transactional |
| Max Zones With Billing On Same Day | Transactional |
| Max Bill Hour Count In Day | Transactional |
| Last Txn Date | Transactional |
| First Txn Date | Transactional |
| First redemption date | Transactional |
| Last Redemption Date | Transactional |
| Lapsation Date | Transactional |
| First Points redemption date | Transactional |
| Last POints Redemption Date | Transactional |
| first_awarded_date | Transactional |
- If the user selects any of the Behavioral KPIs while creating OU level segments ,then he is informed by a message that “This KPI is not available for OU level rule set definition. You can create org level segments using these.”
- Post this the user can select the segmentation level to org and then proceed to org level segmentation
Org Level Segmentation
- The user selects the option to create segment on the org level
- When segments are created via ‘conditions‘, the conditions are applied to all the customers of the org.(ie , customers who have transacted in any of the OUs)
- The created segment will be available/visible in the segments list when the user selects the org name (not any specific OU) in the ‘Select Organization’ drop down.
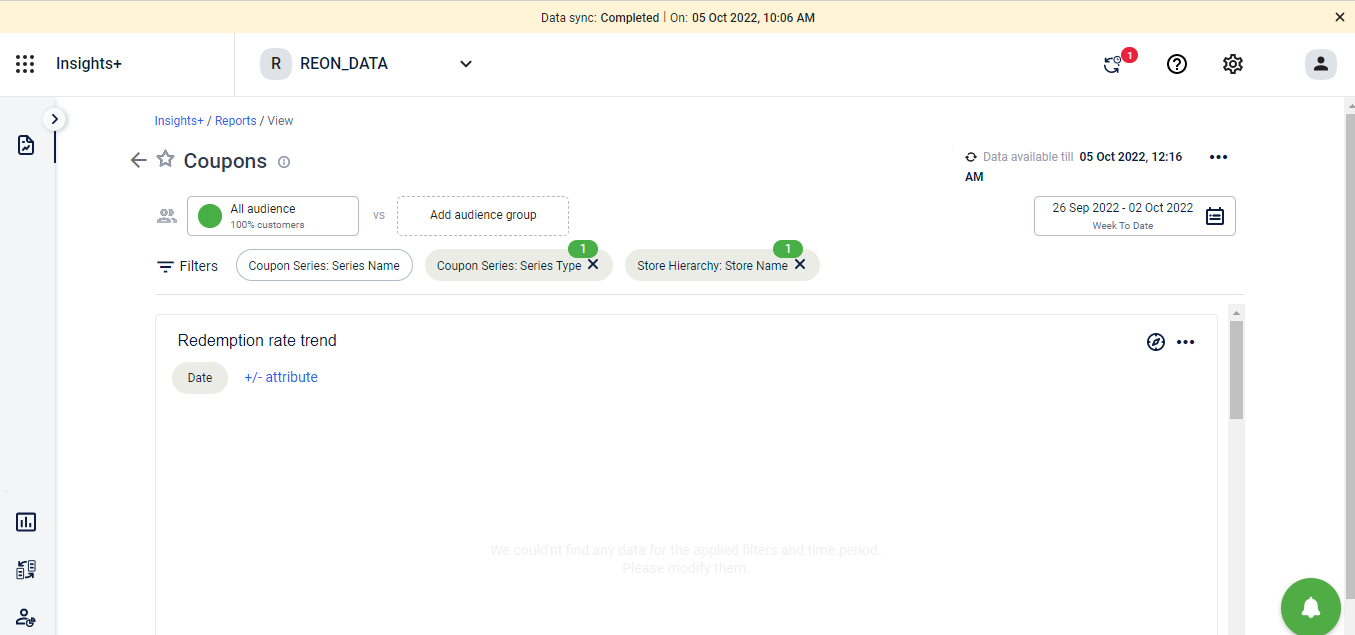
Filtered view of reports [Quick Filters ] -( For Coupons Report only)
Purpose/Goal (Why ?):
- Presently , on Insights , the user has an option to apply the filters on the standard reports as shown in the screenshot below.
- However, for the most basic of standard filters , the user will have to scroll the entire list of filters / search for the filter and then apply it.
- There is no upfront view of the filters which the user can apply instantly.
- By providing the users ready to use filters upfront, we mean to
- Improve the visibility of the basic/standard filters in turn improving the filter application usage
- Provide one click solution to the users for filter application to reduce the time and hassle.
Use cases and Solution (What ?):
Use case 1: The user should be able to see the quick filters upfront on the page of any standard report.
Solution:
Once the user opens the standard report , he will be able to see the predefined quick filters for that particular standard report on the report page itself.
Below are the details of the report and its quick filters:
| Report | Existing Filter selected | Quick filter names | Functionality |
|---|---|---|---|
| Coupons | Coupon Series:series type | Coupon Series:SeriesType | Filter data in reports on coupon Series type as selected by the user |
| Coupons | Coupon Series:Series Name | Series Type: Series Name | Filter data in reports on coupon Series name as selected by the user |
| Coupons | Store Hierarchy: Store Name | Store Hierarchy: Store Name | Filter data in reports on store name as selected by the user |
Use case 2: The user should be able to apply a single quick filter or a combination of quick filters to the report.
Solution:
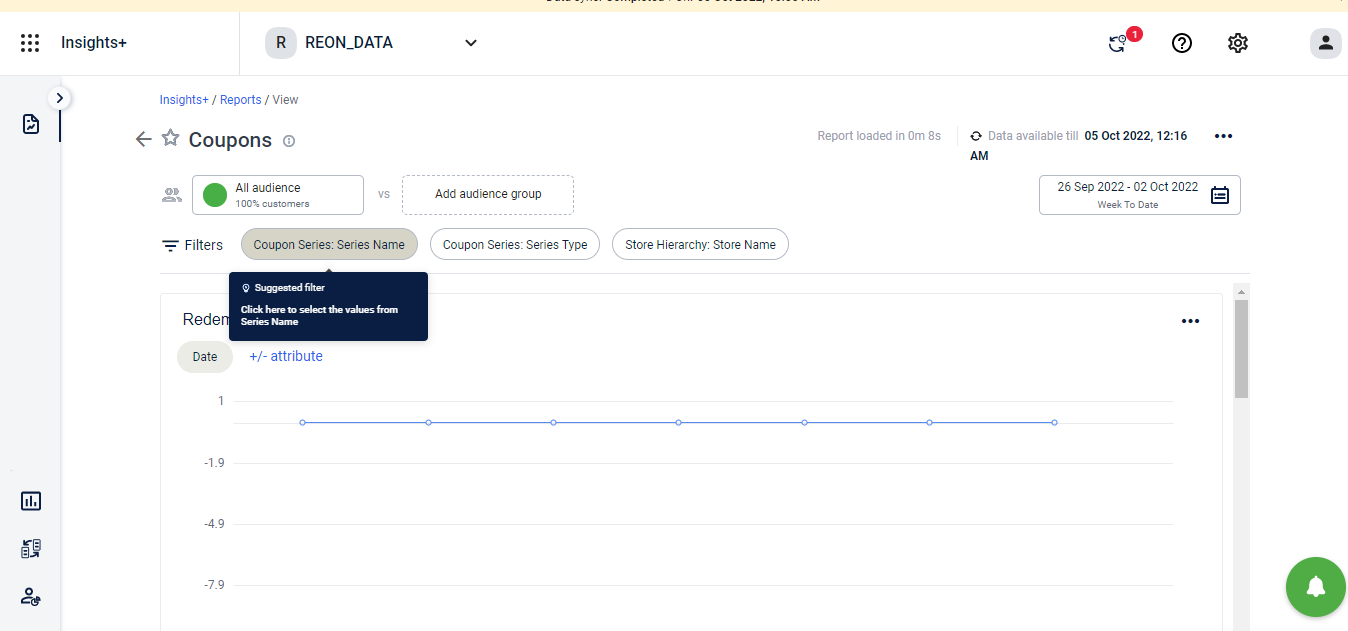
- The user can see the list of quick filters once he opens the standard report.
- To apply any of the filters, he can simply click on the filter, select the value from the dropdown and the data in the report will filter accordingly.
- To apply multiple filters, he can simply click on the other filters and data in the report will be filtered as per the combination of all the filters applied
Use case 3: The user can easily deselect the quick filters applied.
Solution:
- To deselect the applied quick filters , the user will have the option to deselect / cross out the applied filter
- Once the user deselects the applied filter, the report data will change accordingly.
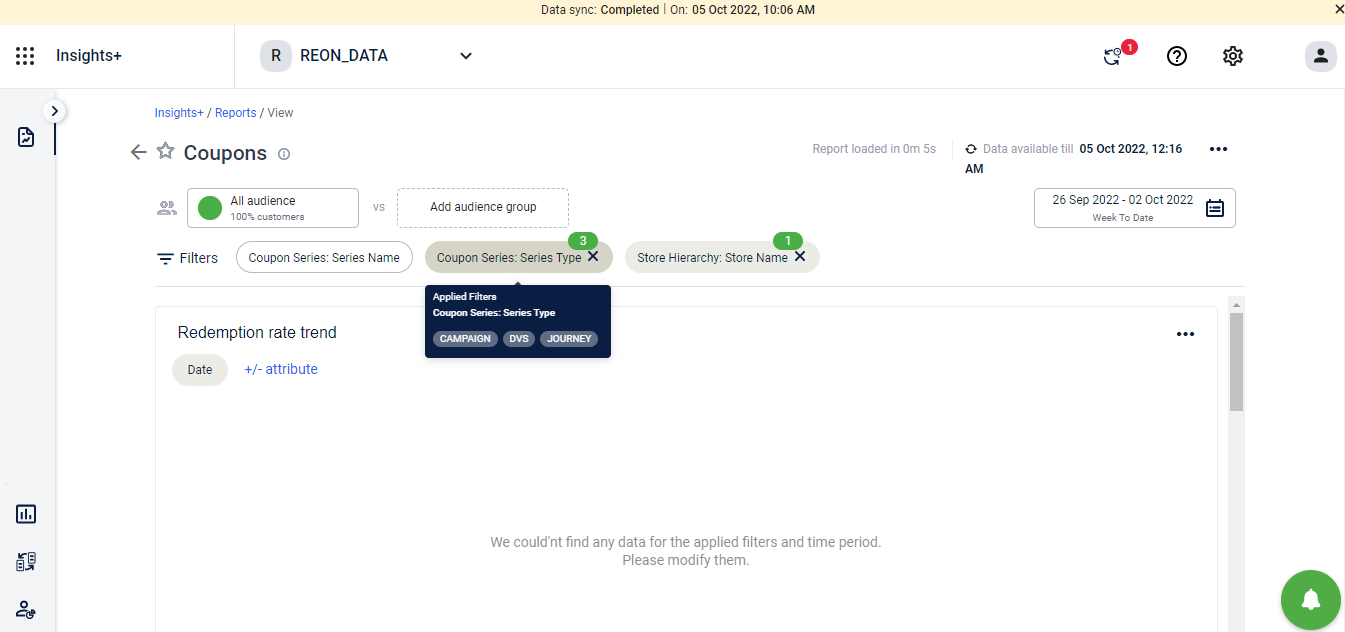
Use case 4: The user should be able to see which all filters are applied to the report without opening the individual filters
Solution:
- Once the filters are applied to the report, the user can hover over the applied filters and in the tooltip he can view all the filter values that are applied on the report