
Overview
Understanding Data Storage Architecture and Usage
This section aims to provide a comprehensive understanding of the architecture of the data storage system within our databases and its usage across various products.
Our data storage and retrieval system utilizes Databricks and Data Lake/ Data Warehouse.
Databricks
Databricks offers a comprehensive set of tools that make it easier to bring data from different sources together to one platform. With this, we can organize the data, store it securely, share it, analyse it to find insights, and create models to predict future trends.
Databricks operates within a Spark/Hive environment. In the Spark/Hive environment, Spark is often used for data processing and analytics tasks that require fast, in-memory computation. On the other hand, Hive serves as a data warehouse solution for managing structured data and executing SQL queries on large datasets stored in distributed storage systems. Together, they form a robust ecosystem for processing, querying, and analysing big data.
Data Lake/ Data Warehouse
A data lake is a large and centralized repository that stores vast amounts of structured, semi-structured, and unstructured data in its raw form. Data lake allows data to be stored as-is, without any prior formatting or organization. This flexibility enables organizations to store diverse types of data from various sources.
- Storing Existing Data Components
Our data storage system is structured in a STAR Schema Layout, comprising facts, dimensions, and summaries. Additionally, we operate within a Multi-Tenant Environment. In the Multi-Tenant Environment, multiple users or entities (tenants) share the same infrastructure or platform. However, within this shared environment, each tenant's data is kept separate and isolated from others at both the storage and SQL level. Each tenant has its own designated storage space and SQL processing capabilities, ensuring that their data remains private and secure from other tenants' data. This isolation helps maintain data integrity, confidentiality, and security within the shared environment.
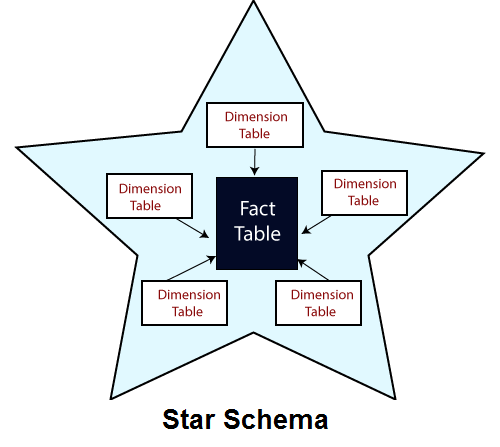
Star Schema Layout
In a star schema, there are typically two types of tables: fact tables and dimension tables. For example, A customer buys a product at a particular store. Here, sales transaction represents the fact and attributes related to this sale, such as product and customer information represent the dimension. So a single facts table is linked to multiple dimensions tables.
Fact Tables
These tables contain quantitative data, typically numerical values that represent the measurements or metrics of a business process. Sales Transactions Fact Table in the current example (of a customer buying a product) will have columns such as transaction ID, product ID, customer ID, sale amount, sale date, etc. Also, each row represents a single sale transaction, with references to the associated product and customer.
Dimension Tables
Dimension tables contain descriptive attributes or characteristics of the data in the fact table. These attributes provide context for analysing the data in the fact table. In the current example, Dimension tables would contain the following details:
| Product Dimension Table | Customer Dimension Table | Time Dimension Table |
|---|---|---|
| Contains details about the products sold. | Contains details about the customers. | Contains information about time-related attributes. |
| Columns: product ID, product name, category, brand, price, etc. | Columns: customer ID, name, address, email, etc. | Columns: date, day of week, month, quarter, year, etc. |
Utilization of Data
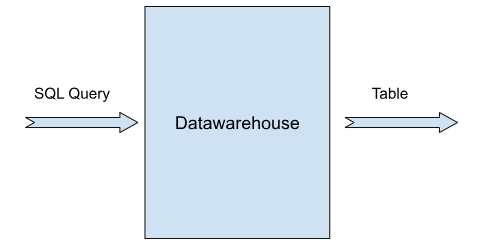
The data stored in the data warehouse is then utilized for various purposes. The data utilization process involves issuing SQL queries to interact with the stored data, processing these queries within a data warehousing environment, and creating tables useful for further analysis.
Examples
Given below are a few examples where the extracted data is utilized.
Creating Reports
The data is utilized while creating reports for the brands. Reports are primarily comprised of charts. Two major components are used while creating charts. They are Key Performance Indicators (KPIs) and Dimensions.
- KPIs are the numerical measurements or metrics used to evaluate the performance or success of a particular aspect of a business. They are created using DSL/JSON, then converted to SQL.
- Dimensions are like labels or categories that help organize data. They act as filters, letting us group data based on different categories, like time periods or types of products.
Example - You can analyse sales data for a particular zone. So sales information will be the KPI and store information will be the dimension. This analysis will give you insights to how the brand is performing in a particular zone. Also, you can add more dimensions like product type and date, to get a more comprehensive business analysis.
Audience Grouping
Using Audience Manager, you can create different audience groups based on specific criteria. Creating audience groups helps target the right customer at the right time, making campaigns more effective. You can create and manage groups separately based on information like behaviour, interests, demographic details, transactions, and more. For instance, you can get high spending customers that did not visit your stores for the last three months.
Example- You can see the product performance (based on product category) for an audience group (high-value customers) for a specific time duration e.g.. January 2023 and January 2024. This will give a comparison of the audience behaviour with respect to time.
Exporting
We can export the datasets in raw format. While exporting, it does not group data by dimensions, but instead provides raw data for additional visualizations.
You can export the data using Export Templates. These templates consist of a list of queries that prohibit fact-to-fact joins. Fact-to-fact joining refers to the process of combining or merging two sets of data that are both at the same level of detail and represent different measures or facts. It involves joining two fact tables together directly, without any dimensions acting as intermediary layers. This type of joining is often avoided in data modelling and analysis because it can lead to redundant or inaccurate results and can be computationally exhaustive. Instead, data is typically joined through dimension tables, which act as intermediary layers between fact tables and help to maintain data integrity and accuracy. So the export templates generate SQL queries that retrieve data from Databricks and export it. This feature offers flexibility, allowing users to specify conditions such as date range and frequency.
Example: Various types of data, such as customer information, transaction details, coupon usage, loyalty points, footfall data (the number of people visiting a physical location), and information related to marketing campaigns, can be exported. Once exported, this data can be analysed and processed by users or analysts at their end.
Addition of New Data
Suppose, you want to introduce a new operational model, such as badges. Badges are like virtual stickers given to customers in loyalty programs to reward them for doing certain things or reaching goals. They make the program more interesting and give customers a sense of pride and achievement, encouraging them to keep participating and stay engaged.
So when badges model is introduced, a new table is generated following the star schema structure. This table incorporates new facts and dimensions relevant to the badges data. Once the onboarding process (i.e, data ingestion) is done, we can leverage this new dataset to create Key Performance Indicators (KPIs) for analysis and monitoring purposes. This process ensures that the newly acquired data is seamlessly integrated into our existing data architecture, enabling us to derive valuable insights from it.
Example of facts and dimensions tables
Consider the badges facts and dimension tables:
For Badges, there are 3 facts tables linked to 5 dimension tables.
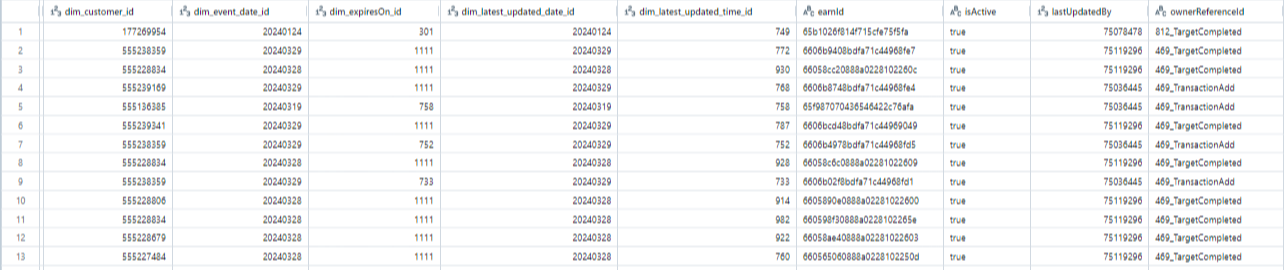
Badges Facts Tables are:
- Badges Earn
- Badges Issued and
- Badges Earned Benefits
E.g. Badges_earn Facts Table Screenshot (sample)
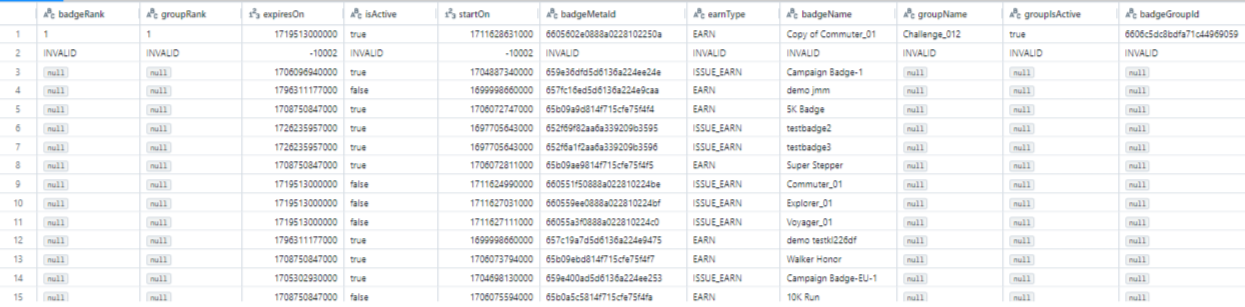
Dimension Tables that are linked to the Badges Facts Table are:
- Badge meta
- Badges owner type
- Coupon series
- Users
- Date
E.g. Badge_meta Dimension Table Screenshot (sample)
Updated 17 days ago