
KPI and dimensions
This page provides you information regarding KPIs and dimensions. KPIs and dimensions are one of the building blocks of Insights+.
KPI
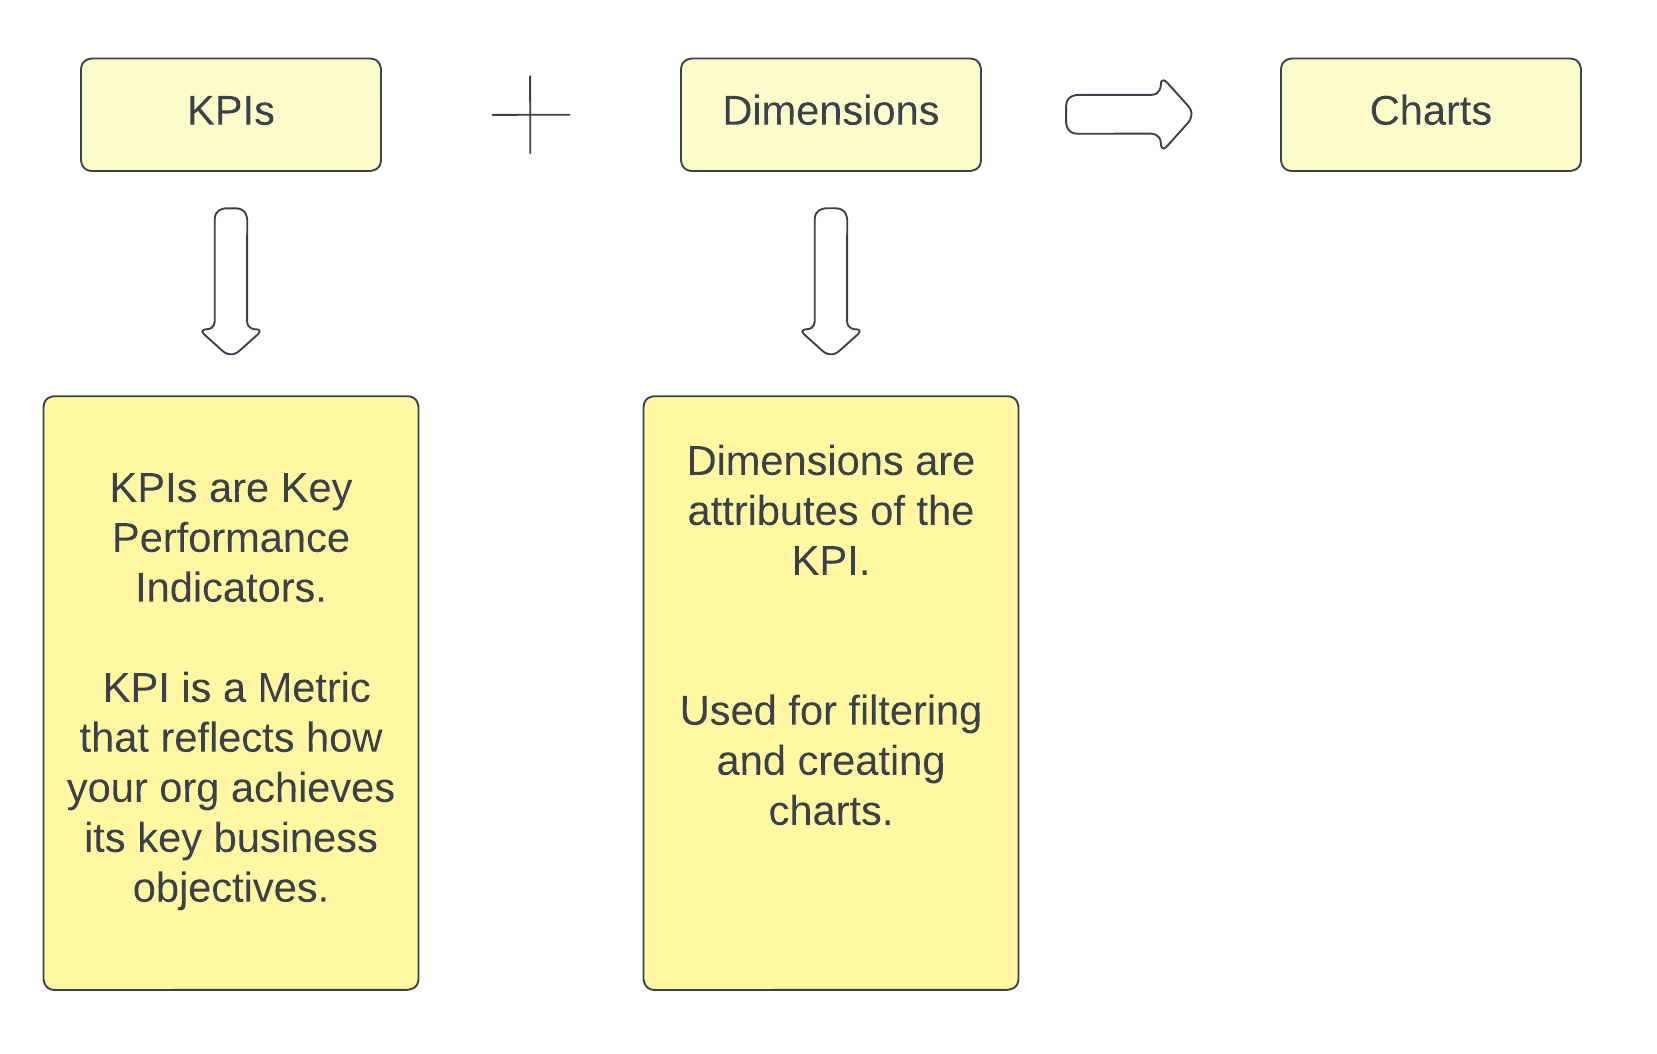
A Key Performance Indicator (KPI) is a specific metric that reflects how effectively your organization achieves its key business objectives. KPIs are displayed using the data ingested on Insights+.
For example, KPIs such as Points redeemed, Total spent, etc give you information about the points redeemed by the customer and total spend by the customer.
NoteTo create a custom KPI, contact Capillary's support team.
To view the KPIs, perform the following:
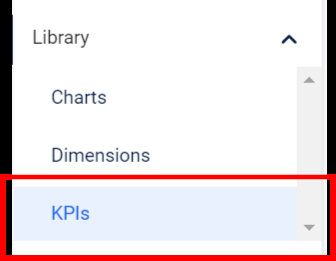
- On the Insights+ homepage, expand the Library dropdown.
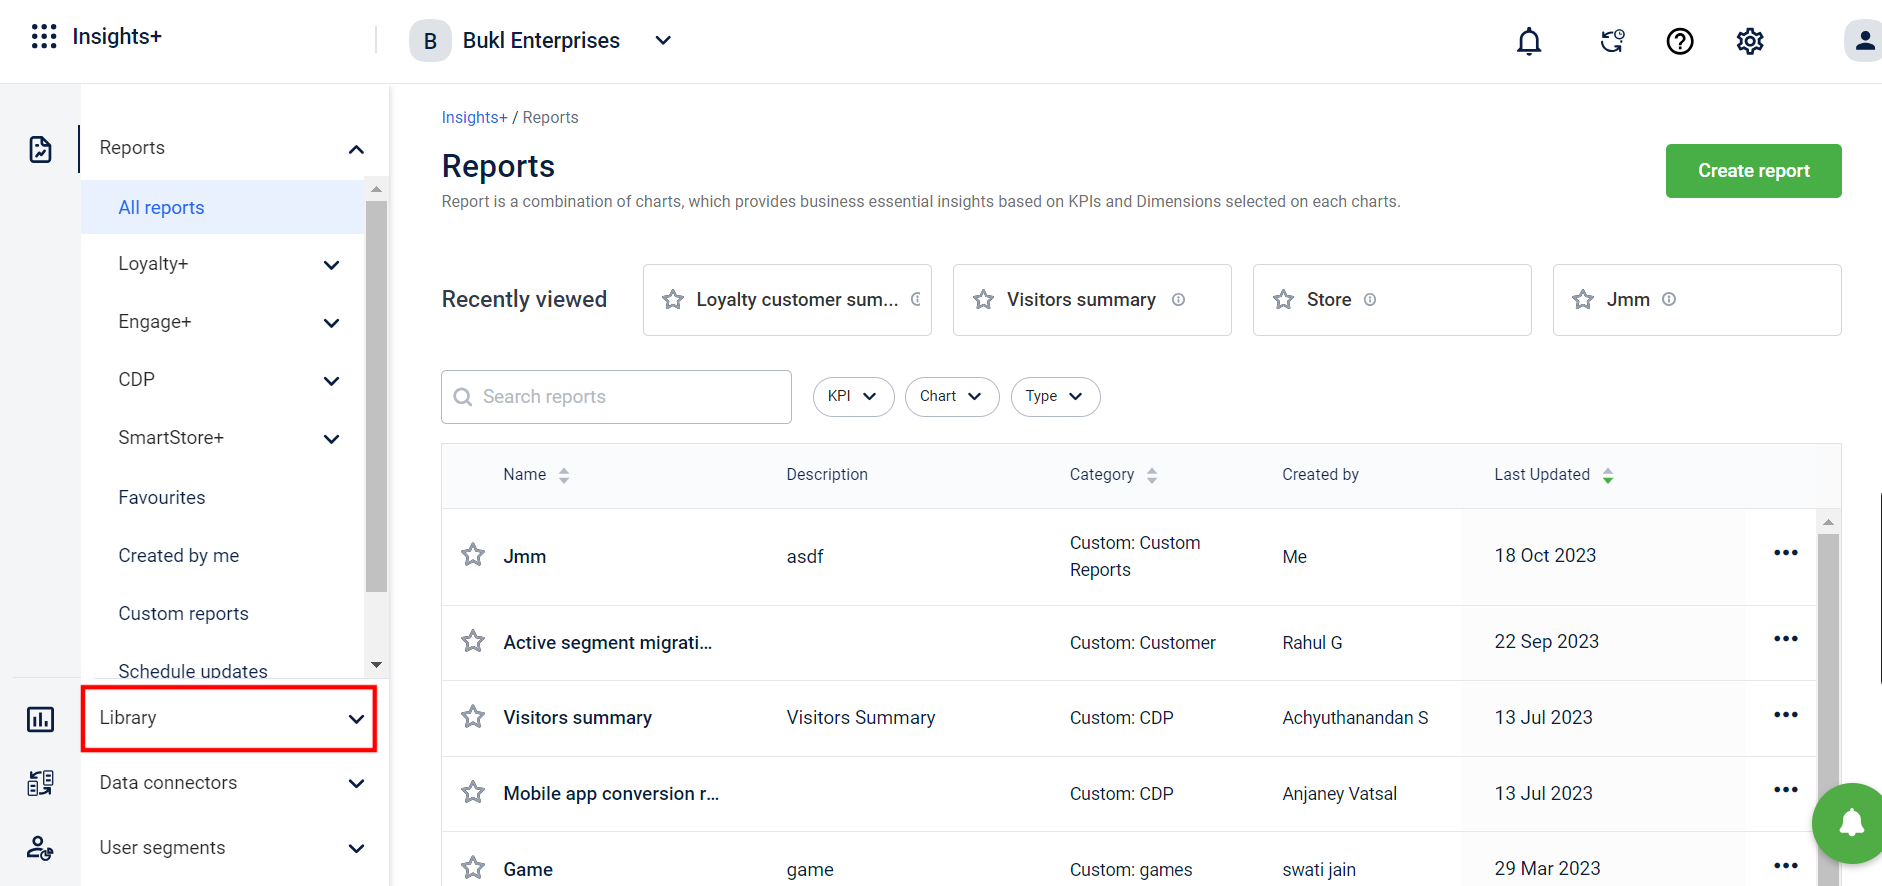
- From the dropdown, select KPI.
-
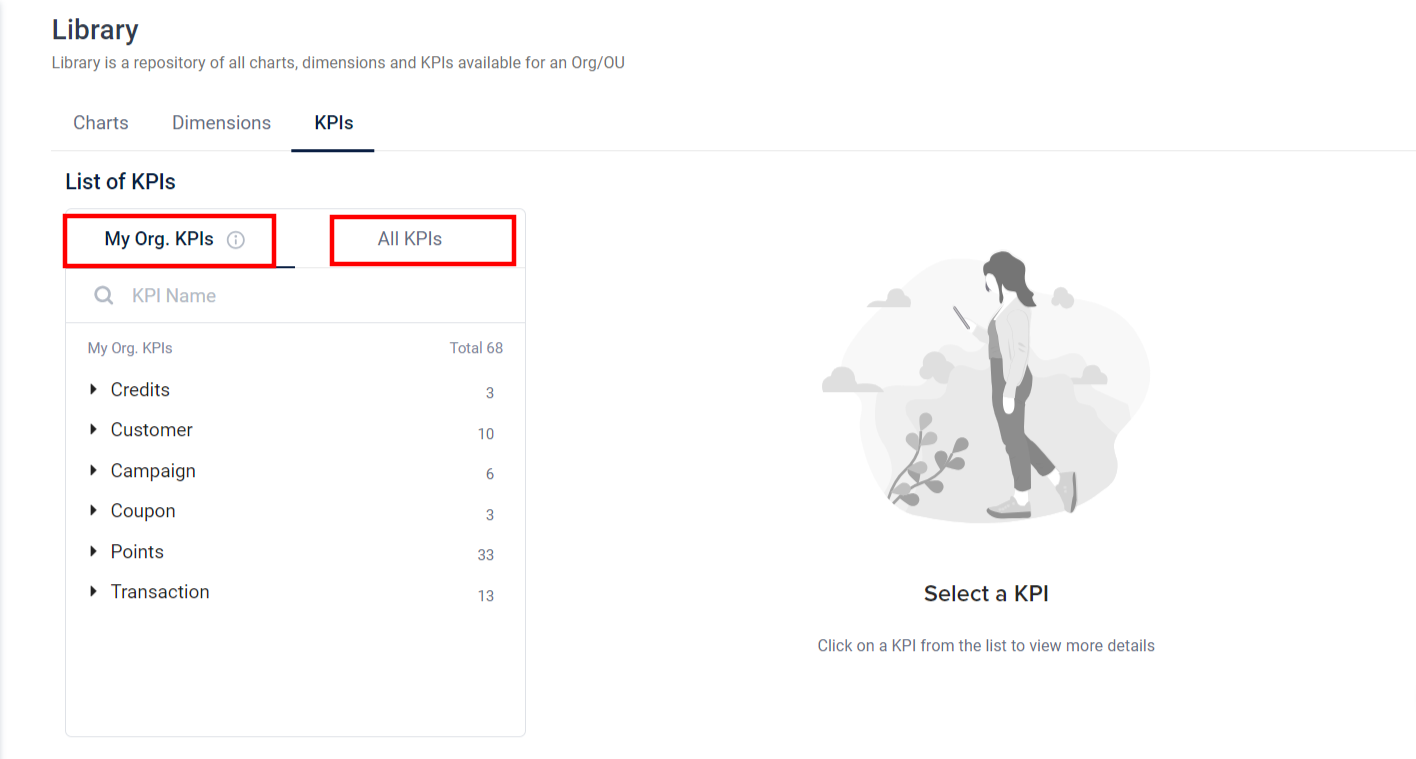
Click My Org KPIs to view KPIs created by your org, along with the KPIs used within your org.
Click All KPIs to view KPIs available across all orgs.
-
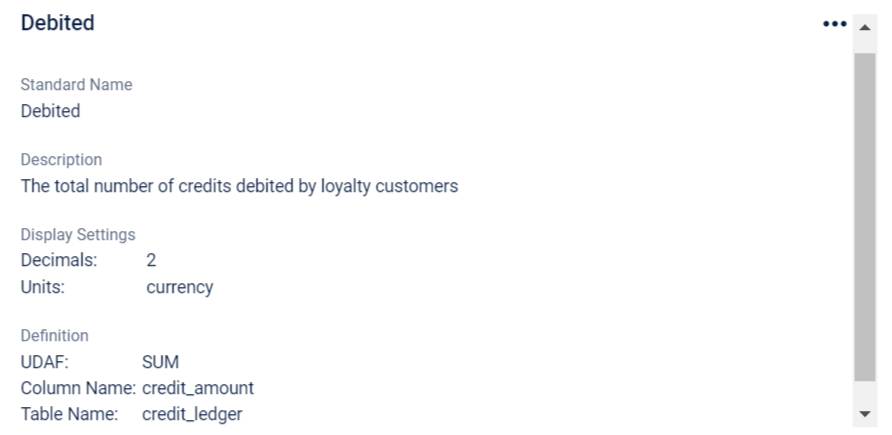
Click on any KPI of your choice to view additional information such as KPI name, description, and KPI settings regarding the KPI.
Dimension
Dimensions are descriptive attributes or categories that provide context to data. They are often used to filter data for better understanding and analysis. To see the full list of dimension tables available in Insights+ and their descriptions, refer to the Dimension Tables documentation.
For instance, consider an organization with ‘Monthly Sales Revenue’ as its KPI and “Product Categories” and “Geographical Location” as its defined dimensions.
By using these dimensions, the organization can extract meaningful insights. For example, they can understand ‘Monthly Sales Revenue for Home Appliances’ or ‘Monthly Sales Revenue in North America’ based on the specific product category and geographical region.
To view the Dimensions, perform the following:
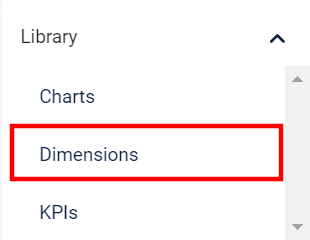
- On the Insights+ homepage, expand Librarydropdown.
- From the dropdown, select Dimensions.
- You can view the dimensions from the dimensions list.
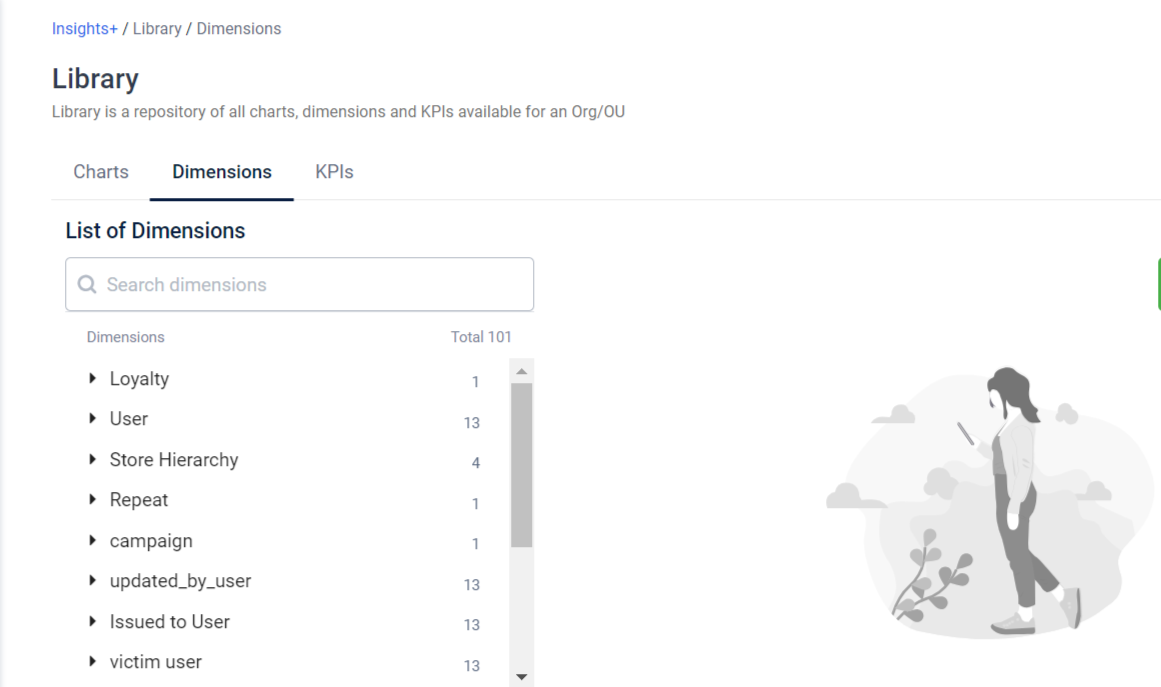
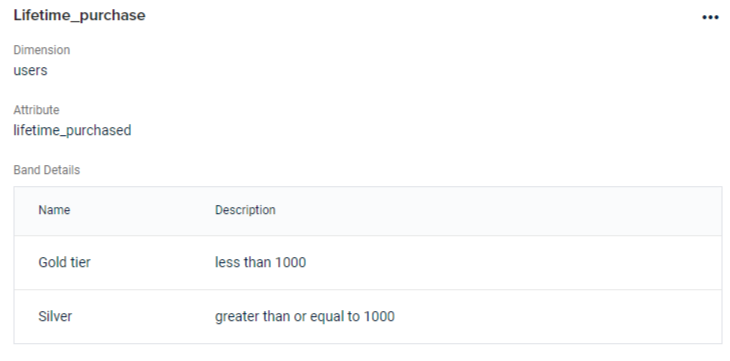
- Click on any dimension of your choice to view information about the dimensions such as dimension name, attribute, band details, etc.
Creating a custom dimension
Custom dimensions are created through banding on dimension tables. To create a custom dimension, perform the following:
- On the Insights+ homepage, expand the Library dropdown.
- From the dropdown, select Dimensions.
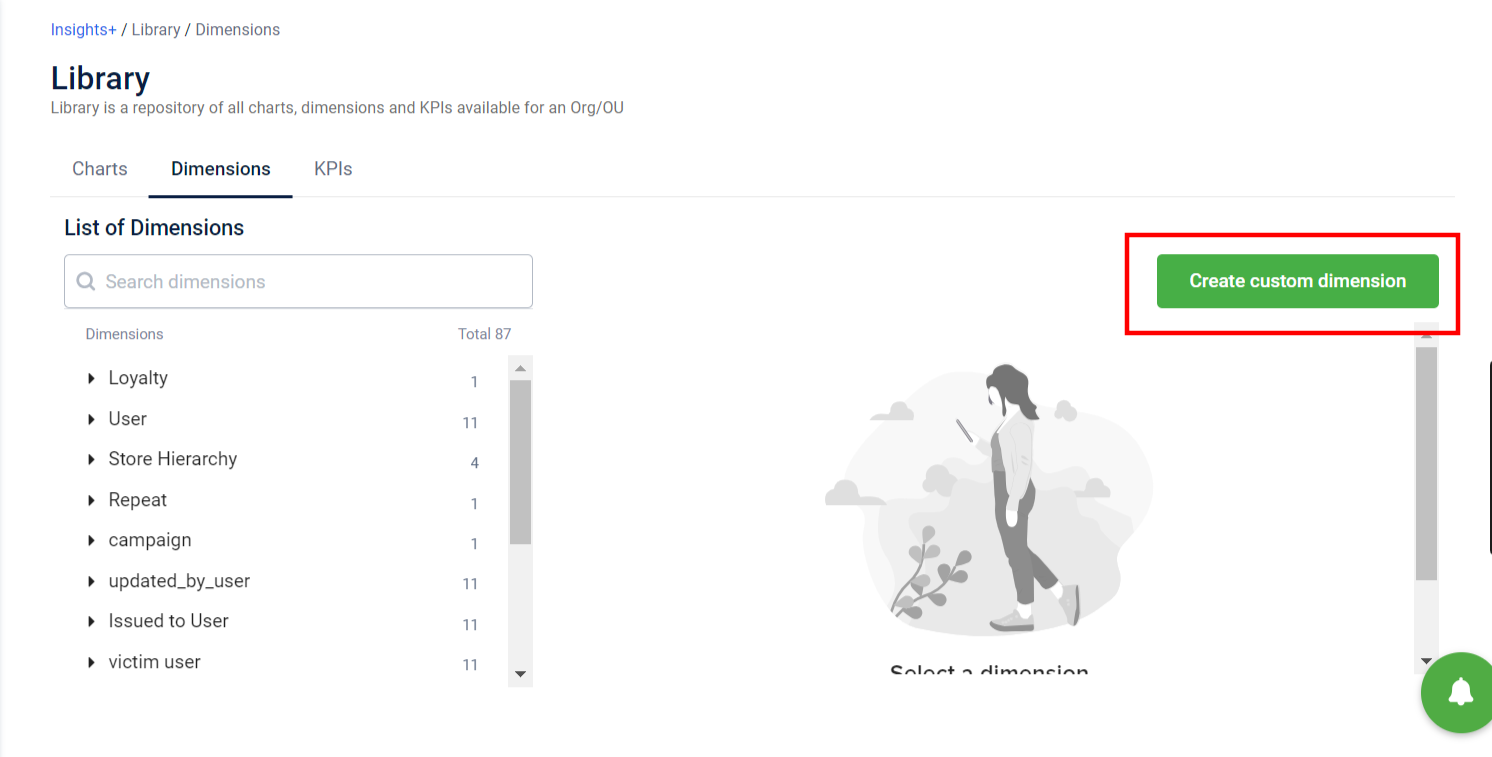
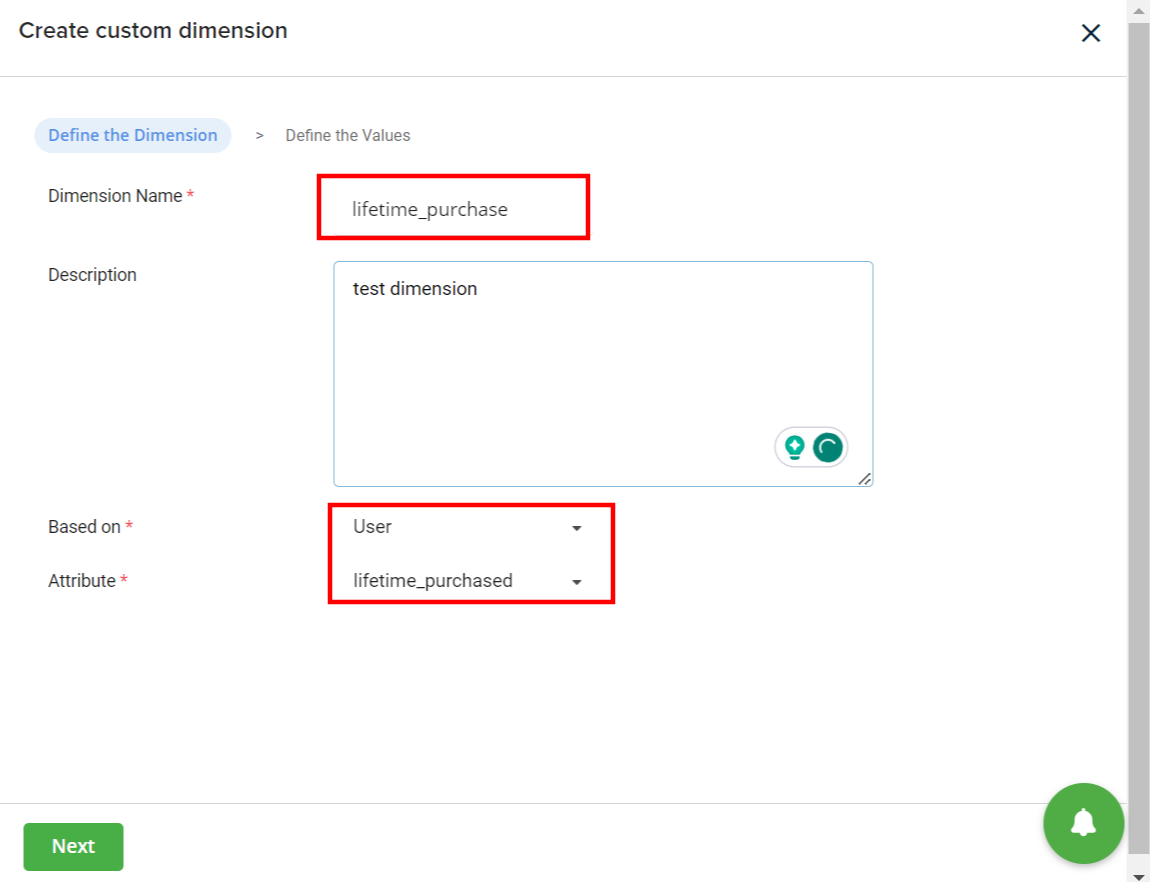
- Click Create custom dimension.
- Enter the dimension name, description, and details on the basis that the data should be segregated, and click Next.
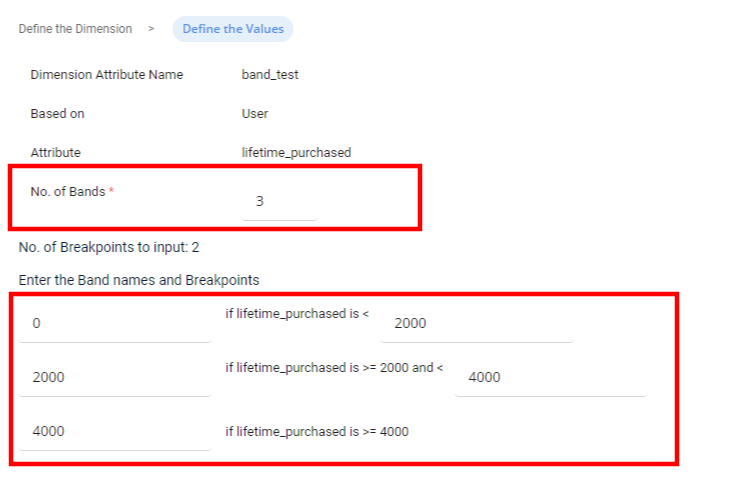
- Enter the number of bands, and input the band names and the breakpoints.
- Click Create.
You have successfully created a dimension.
Where are KPIs and dimensions used?
You can use KPIs and dimensions to create charts such as migration or normal charts, that provide you insights into your product or organization. For more information on charts, refer to the documentation on charts.
Updated 4 months ago