
Rewards+Dashboard
Rewards+ supports various standard and campaign reports through Tableau. Below are some of the available reports and how you can view them.
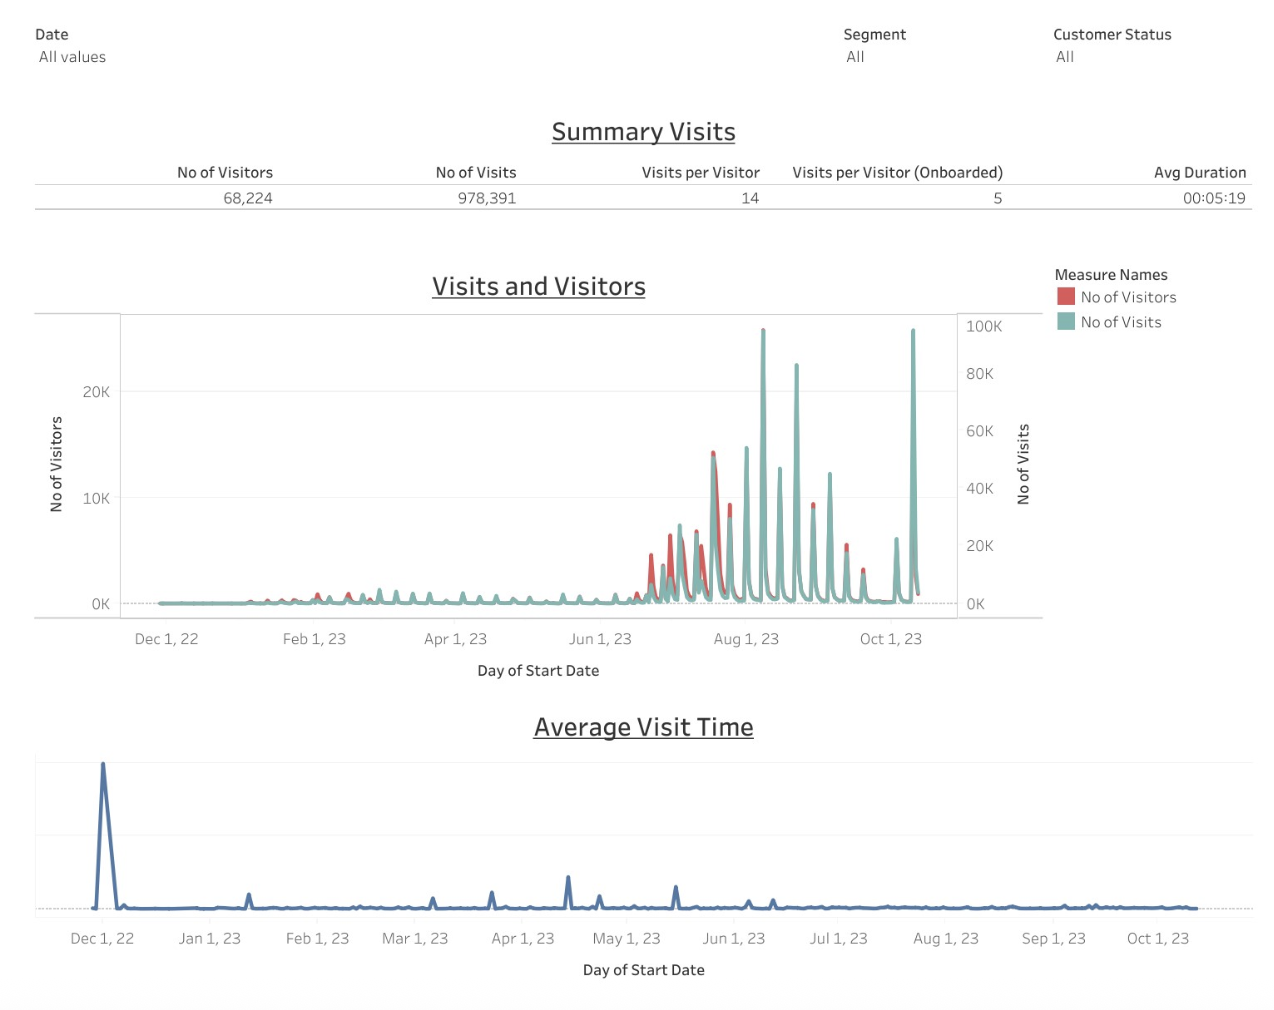
REQ 01: Visits
Purpose
Track visits and visit trends over a selected date range.
Dashboard widgets
-
Summary visits: Shows the total number of visits, unique visitors, and average visit duration.
-
Visits & visitors: Displays monthly trends for visit and visitor counts.
-
Average visit time: Displays the monthly trend of average session duration.
KPIs
-
Number of Visitors: Unique customers who started at least one session on the loyalty site.
-
Number of Visits: Total unique sessions on the loyalty site.
-
Visits per Visitor:
Number of Visits / Number of Visitors -
Visits per Visitor (onboarded): Sessions per onboarded customer who completed the onboarding process.
-
Avg Duration: Average time a customer spent per session on the loyalty site.
Filters
-
Date: Select a start and end date.
-
Customer segment: Choose one or more customer segments. Default: All.
-
Customer status: Choose from ACTIVE, DELETED, or NULL. Default: All selected.
How to use
-
Select a date range from the date picker.
-
Filter by customer segment or customer status if needed.
-
Click any chart bar or line for more details.
-
Hover over data points to see tooltips.
REQ 02: Onboarding
Purpose
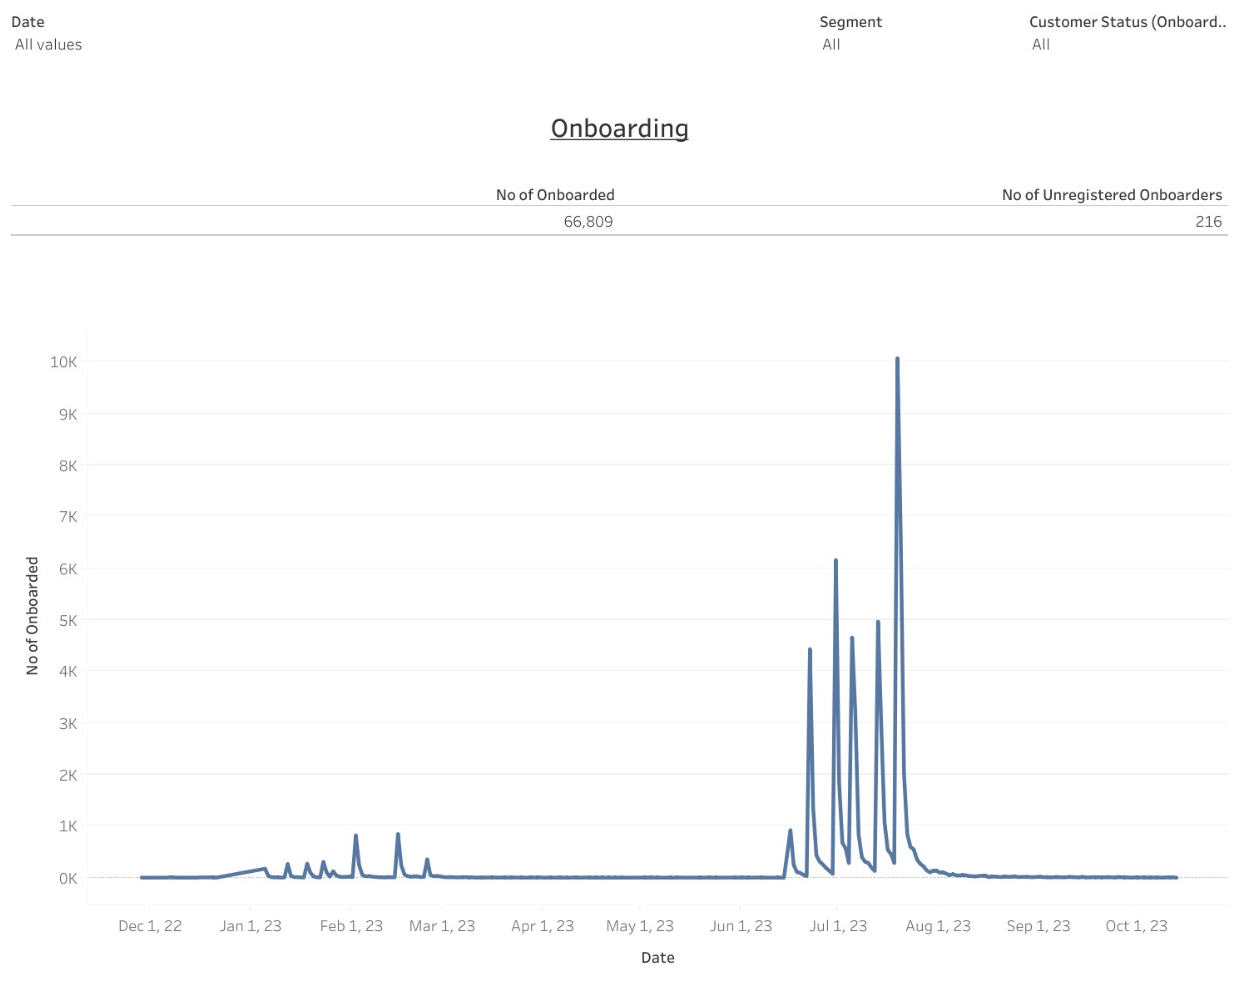
Track customers who completed the onboarding process.
KPIs
-
No. of Onboarders: Unique customers who registered and completed onboarding.
-
No. of Unregistered Onboarders: Unique customers who completed onboarding without registration.
Filters
-
Date: Select an onboarding date range.
-
Customer segment: Choose one or more customer segments. Default: All.
-
Customer status: Choose from ACTIVE, DELETED, or NULL. Default: All selected.
How to use
-
Select a date range for onboarding.
-
Filter by customer segment or status.
-
Click any chart bar or line for more details.
-
Hover over data points to see tooltips.
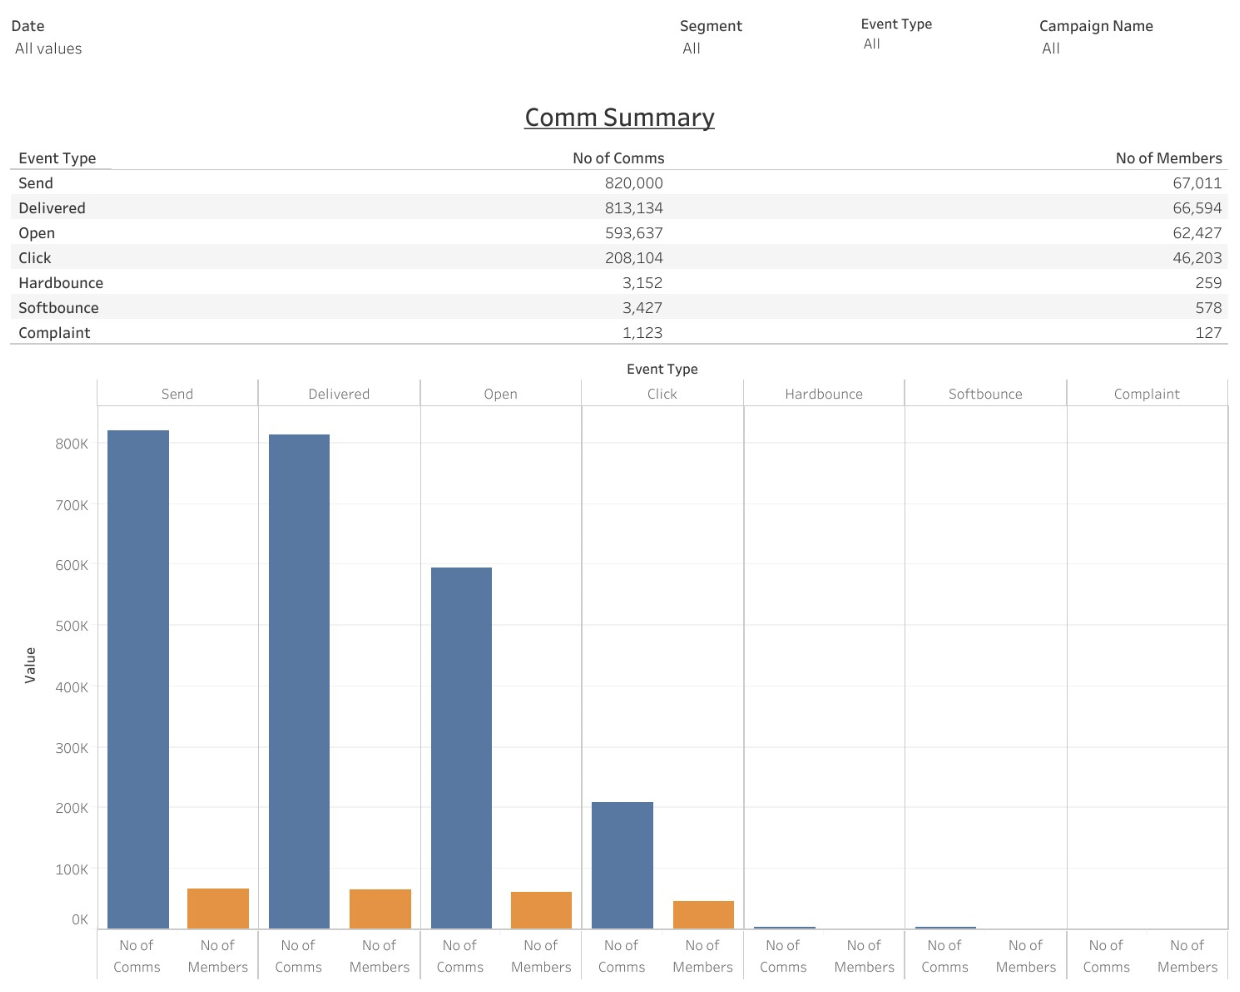
REQ 03: Communications
Purpose
Track communication metrics across campaigns and event types.
Dashboard widgets
This dashboard summarises the number of communications sent, delivered, opened, clicked, bounced, or marked as spam.
KPIs
-
No. of Comms: Unique count of communications by event type.
-
No. of Members: Unique customers associated with the selected events.
Event types
-
Send: Emails successfully sent.
-
Delivered: Emails successfully delivered to the recipient.
-
Open: Emails successfully opened by the recipient.
-
Click: Links in the email successfully clicked by the recipient.
-
Hard Bounce: Permanent email delivery failure (e.g., invalid address).
-
Rendering Failure: Email not displayed correctly in the recipient’s email client.
-
Soft Bounce: Temporary delivery failure (e.g., full mailbox or server issue).
-
Complaint: Recipient marked the email as spam or reported dissatisfaction.
Filters
-
Date: Select a start and end date.
-
Customer segment: Choose one or more customer segments. Default: All.
-
Event type: Choose one or more event types from the list.
-
Campaign name: Select a specific campaign. Default: All campaigns selected.
How to use
-
Select a date range using the date picker.
-
Filter by event type, campaign name, or customer segment as needed.
-
Click any chart bar or line to drill down into details.
-
Hover over data points to view tooltips with more information.
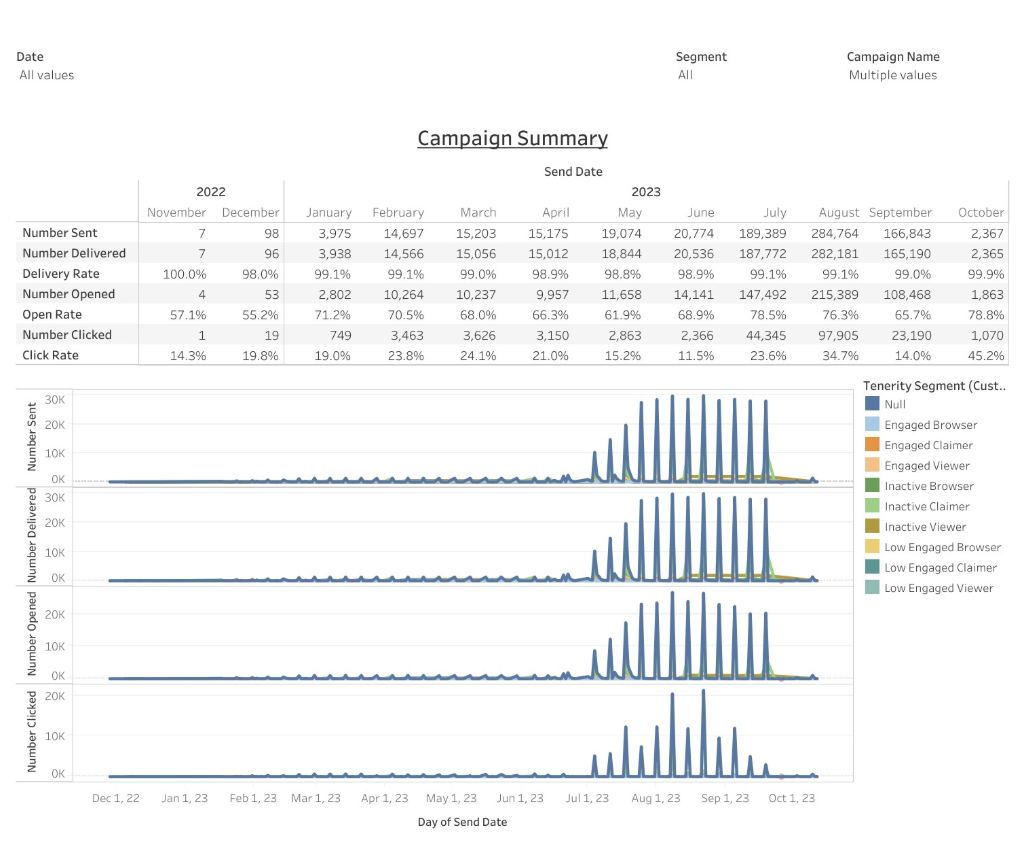
REQ04: Campaign Summary
Purpose
Track the performance of marketing campaigns over time.
Dashboard widgets
This dashboard shows campaign metrics such as emails sent, delivered, opened, and clicked. It also calculates delivery, open, and click rates for each campaign.
KPIs
-
Number Sent: Unique count of messages sent.
-
Number Delivered: Unique count of messages delivered successfully.
-
Delivery Rate:
Number Delivered / Number Sent -
Number Opened: Unique count of messages opened.
-
Open Rate:
Number Opened / Number Delivered -
Number Clicked: Unique count of messages clicked.
-
Click Rate:
Number Clicked / Number Delivered
Filters
-
Date: Select the campaign start and end dates.
-
Customer segment: Choose one or more customer segments. Default: All.
-
Campaign name: Select a specific campaign. Default: All campaigns selected.
How to use
-
Select the date range from the date picker.
-
Filter by customer segment or campaign name if needed.
-
Review the dashboard to see campaign performance metrics.
REQ 05: Interest
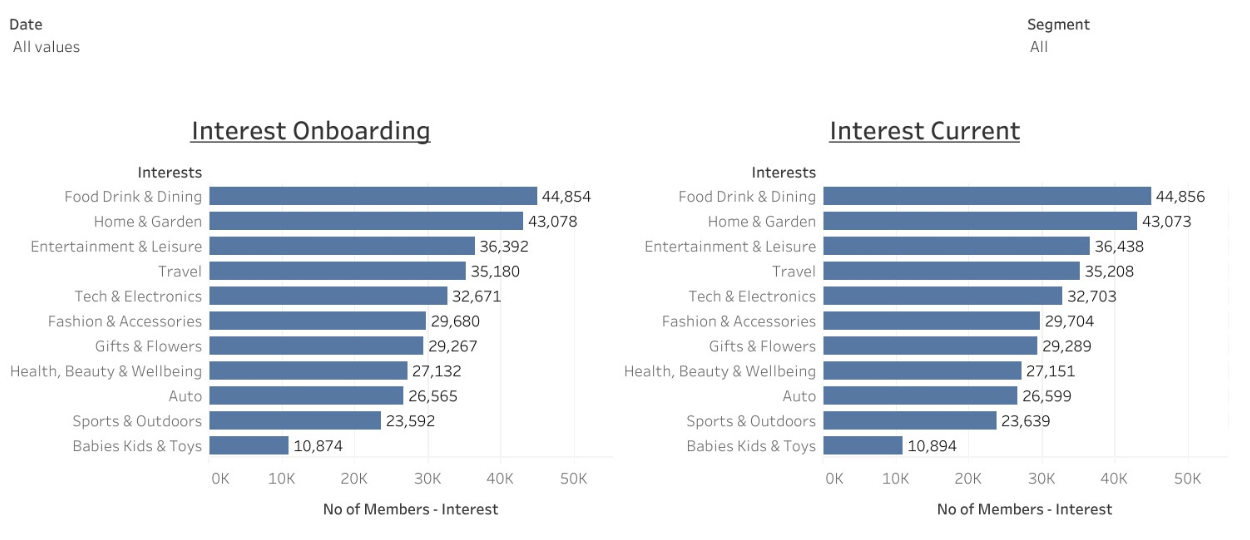
Purpose
Track customer interest selections during onboarding and among active users across segments and dates.
Dashboard widgets
This dashboard provides two views:
-
Interests selected during onboarding.
-
Interests selected by currently active customers.
KPIs
-
No. of Members: Unique customer count.
-
Interests: All interest selections made by customers.
-
Interests Onboarding: Interests selected by customers during onboarding (
Event Name = ONBOARD). -
Interests Current: Interests selected by customers with
Status = ACTIVE.
Filters
-
Date: Select a start and end date for interest creation.
-
Customer segment: Choose one or more customer segments. Default: All.
How to use
-
Select the date range using the date picker.
-
Filter by customer segment if needed.
-
Click any chart bar or line to explore details.
-
Hover over data points to view tooltips.
RREQ 06: Preference
Purpose
Track customer preferences and their current status across segments, types, and time periods.
Dashboard widgets
This dashboard shows customer opt-in data, preference status, creation year, and unique customer counts.
KPIs
-
Has Opted: Indicates if the customer has opted in (
TRUE) or not (FALSE). -
Preference Status: Status of the preference (e.g.,
ACTIVE,CANCELED). -
Created On: Year the preference was created.
-
No. of Members: Unique customer count.
Filters
-
Date: Select a start and end date for preference creation.
-
Customer segment: Choose one or more customer segments. Default: All.
-
Type: Select from preference types (e.g., SMS, Email, Is Adult, Has Accepted Terms).
-
Customer status: Choose from
ACTIVE,DELETED, orNULL. Default: All selected. -
Preference status: Choose from
ACTIVE,CANCELED, orANOMALIZED.
How to use
-
Select the date range using the date picker.
-
Filter by segment, preference type, customer status, or preference status.
-
View the preference chart to analyze opt-in trends and status distribution.
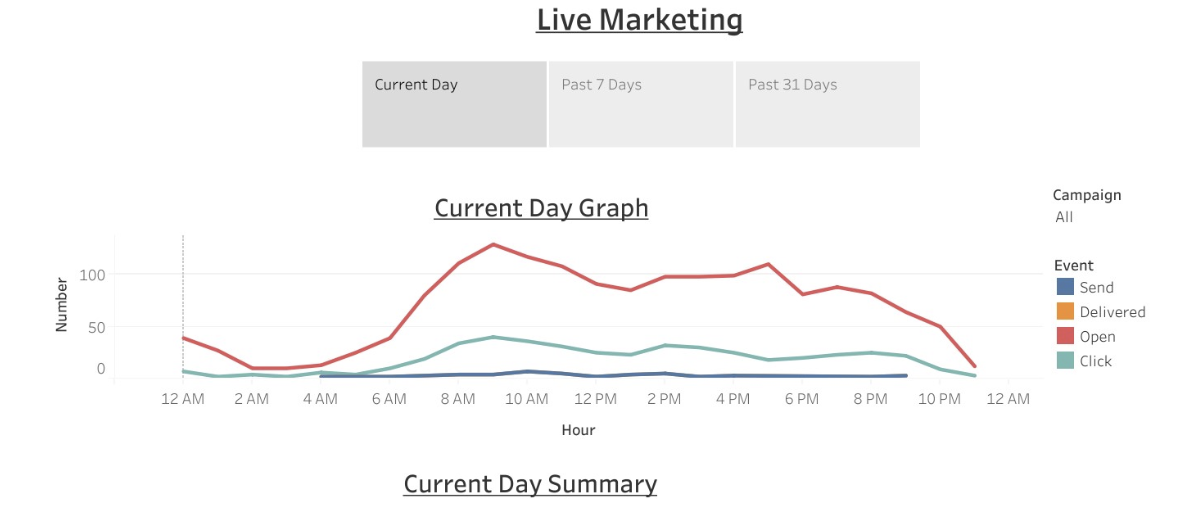
REQ 06: Live Marketing
![][image7]
Purpose
Monitor real-time message delivery metrics for all active campaigns.
Dashboard widgets
This live dashboard shows the number of messages sent across all campaigns for:
-
Current day
-
Past 7 days
-
Past 31 days
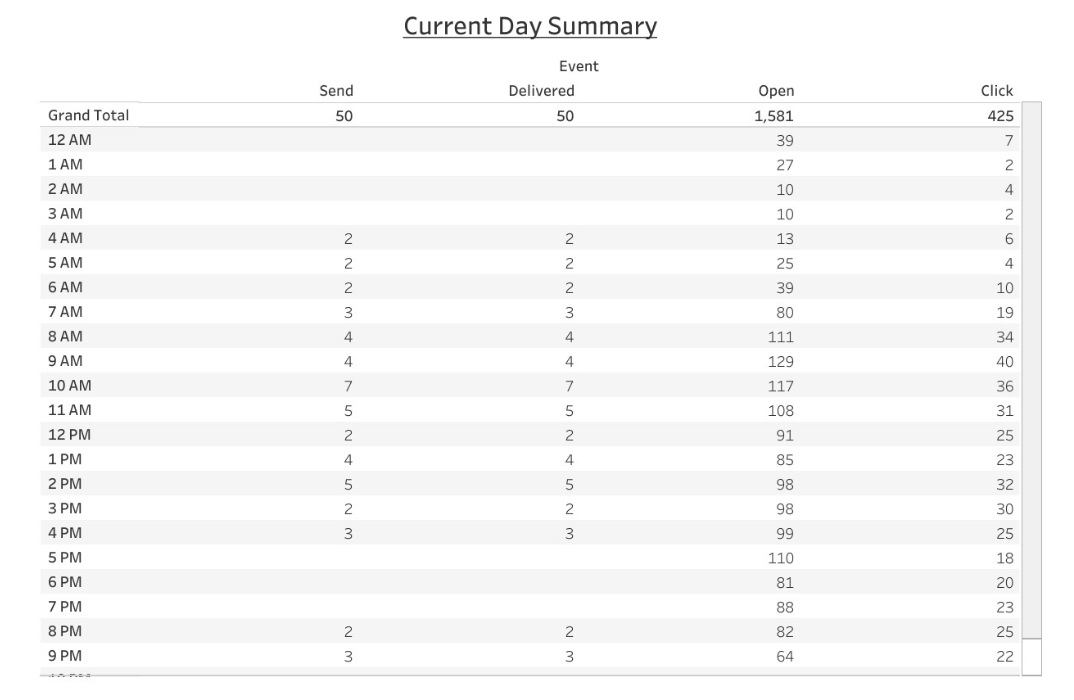
KPIs
- Number of Messages: Count of distinct messages sent for marketing promotions.
Event types
-
Send: Emails sent successfully.
-
Delivered: Emails delivered successfully.
-
Open: Emails opened by recipients.
-
Click: Links clicked by recipients.
-
Hard Bounce: Permanent delivery failure (e.g., invalid email).
-
Rendering Failure: Email failed to display correctly.
-
Soft Bounce: Temporary delivery failure (e.g., full inbox).
-
Complaint: Recipient marked the email as spam or complained.
Filters
- Campaign name: Choose a specific campaign. Default: All campaigns selected.
How to use
-
Select a time period tab: Current Day, Past 7 Days, or Past 31 Days.
-
Filter by campaign name if needed.
-
View message metrics based on the selected time frame.
Updated 5 months ago