
Viewing Power BI Dashboards on Insights
Introduction
The integration of Power BI dashboards into the Intouch Insights portal enables brands to visualise data through interactive and customizable reports. You can apply filters, explore metrics, and analyse data directly within the Intouch environment without switching platforms.
Features
The key features of Power BI integration are:
- Embedded Power BI dashboards
View and interact with Power BI dashboards directly within the Insights portal.
-
Scoped workspace per organization
Access Power BI dashboards in organization-specific workspaces. Each brand is mapped to its own workspace to ensure data separation and security.
-
Mark reports as favourites
Mark frequently used or important Power BI reports as favorites. Use the Favorites filter or section to quickly access these reports. The favorite status persists across sessions.
-
Configure organization-specific settings
Use secure, organization-specific Power BI credentials and workspace configurations to manage access and data visibility.
-
View dashboards in full screen
Expand any embedded Power BI dashboard to full-screen mode for enhanced viewing. The expanded view retains essential Insights UI elements such as the top bar and sidebar.
- Use interactive controls
Interact with embedded dashboards using native Power BI controls:
- Filtering: Apply filters to display only relevant data.
- Sorting: Reorder data within tables and charts based on defined parameters.
- Slicing: Segment and explore specific subsets of data for detailed insights.
Use cases
- Displaying reports with complex KPI conditions in Insights
Requirement
Display a report in Insights that uses key performance indicators (KPIs) based on complex conditions, such as calculating the number of active users during the 180 days from the reporting end date.
Solution
Use embedded Power BI dashboards in Insights to create reports based on complex KPIs that cannot be configured directly in Insights.
- Reporting on custom fields in Insights
Requirement
Create and display brand-specific reports in Insights to include data stored in custom fields, such as the number of customers who signed up for the loyalty program using a mobile device. Insights reports do not natively support reporting on custom fields.
Solution
Use Power BI dashboards integrated with Insights to create and display reports using data from custom fields.
- Customizing report appearance
Requirement
Customize the appearance of reports, such as font types, colors, and layout, that cannot be modified within the Insights UI.
Solution
Leverage Power BI’s design capabilities to apply custom fonts, colors, and visual theming that can be viewed within Insights.
Prerequisites
- Enable Power BI in the organization and connect to Insights
To enable and set up the connection, raise a ticket with the Capillary Product Support Team. Include these details in your request:- Organization ID
- Organization name
- Reporting requirements for the dashboard
This is a paid feature and is not available by default. For pricing information, contact the Product Team.
Viewing a Power BI dashboard report
To view a Power BI dashboards report, do the following:
-
In the Insights+ page, go to Reports > Power BI reports.
You see a list of available Power BI reports for the organization. -
Click the Power BI report you want to view.
You see the Power BI report. Each report consists of graphical representation called visual. -
(Optional) Hover over each visual to see the available interactions.
Note: The filters and options to view the report vary based on the reporting requirements.
The following is a sample Power BI report available in Insights.
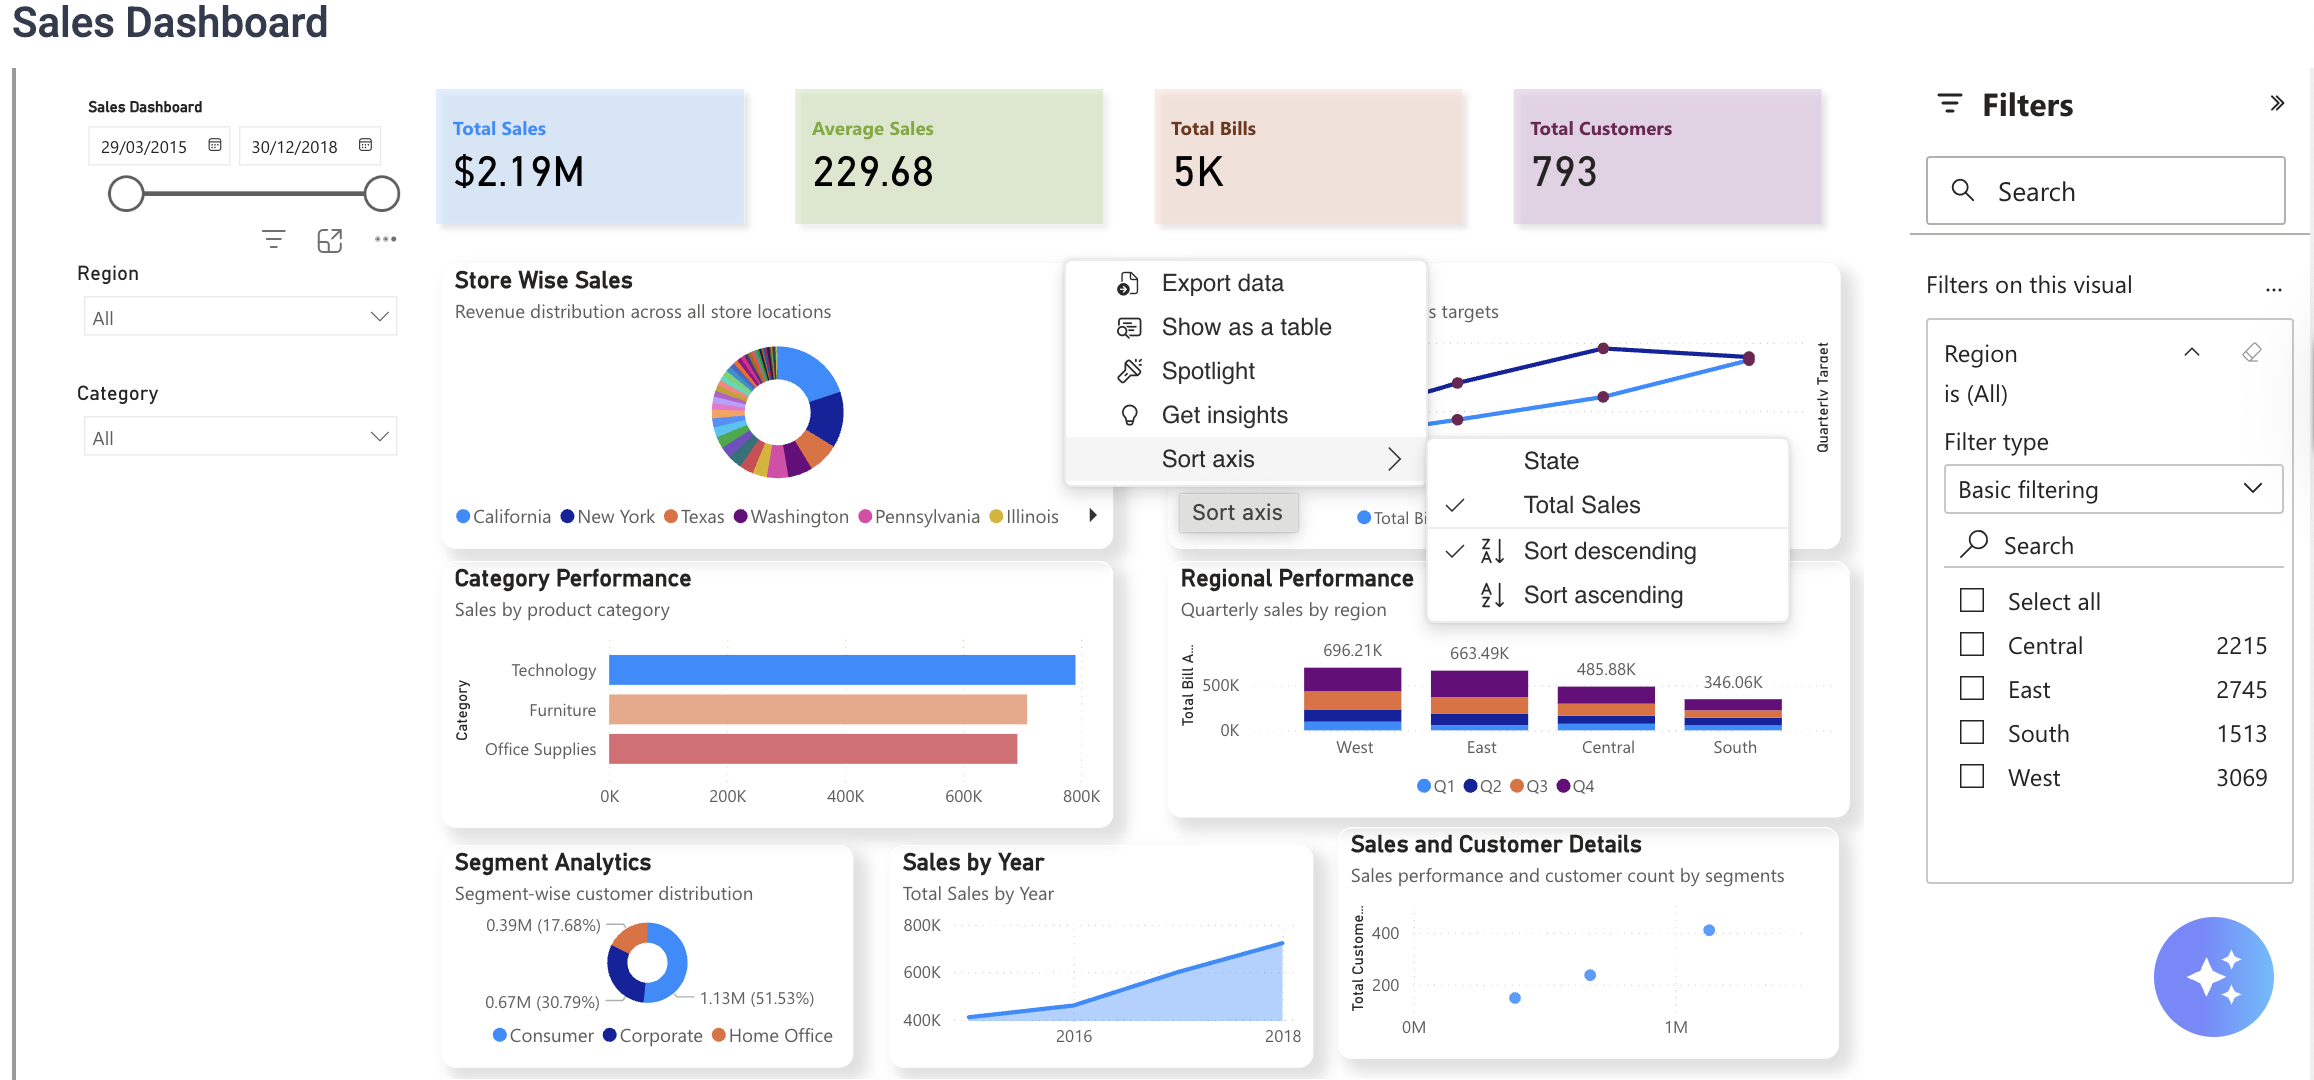
Fair usage policyThe number of times you can apply filters or refresh the dashboard is limited per hour, based on the organization's subscribed plan. For more information, contact the Capillary's Point of Contact.
Interacting with visuals
While viewing Power BI visuals embedded in Insights, you can interact with the data using supported actions. These actions appear when you hover over a visual.
| Actions | Description |
|---|---|
| Copy | Copies the visual with a caption. |
| Filters | Displays filters and slicers that affect the visual. |
| Focus mode | Expands the visual. |
| More Options > Export data | Exports the data in a preferred format. |
| More Options > Show as a table | Displays the data from the visual as a table. |
| More Options > Spotlight | Highlights the visual on a report page. |
| More Options > Get insights | Explores the data to find insights, such as anomalies and trends. This functionality is currently not supported. |
| More Options > Sort axis | Rearranges the order of elements displayed on the x-axis or y-axis of the visual. |
Editing a Power BI dashboard report
To request changes to a dashboard, such as updating KPIs, modifying dimensions, or adjusting filters, submit a ticket to the Capillary Product Support team with the specific changes required.
Limitations
-
Access through Intouch only: Power BI dashboards can be viewed only within the Intouch platform.
-
Mobile view not supported: Dashboards are not optimized for viewing on mobile devices.
-
Not accessible via Power BI portal: Embedded reports are not available directly through the Power BI web interface.
-
Editing Reports in Insights: You cannot edit Power BI reports directly within Insights. All edits must be made in Power BI and updated through JIRA tickets.
FAQs
- Who can enable Power BI integration for an organization?
The Capillary Product Support Team (PST) can enable Power BI integration.
- Who can edit the Power BI integration settings?
The organisation Administrator or the brand manager can edit the integration settings.
- What if I need to update my Power BI credentials later?
You can edit and save updated credentials in the Power BI Settings section. The system will revalidate the updated details.
Updated 5 months ago