
Create and Publish Custom Report
Normal, Migration and Funnel Report
To create a Custom Report perform these steps:
- In Insights+, from the left panel, expand the Reports drop-down and click on All Reports.
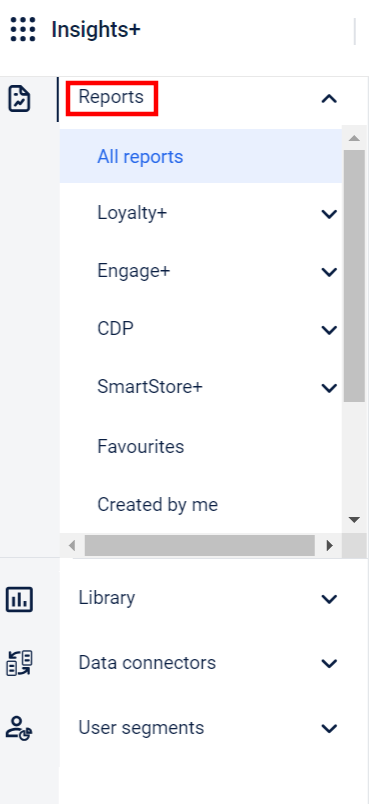
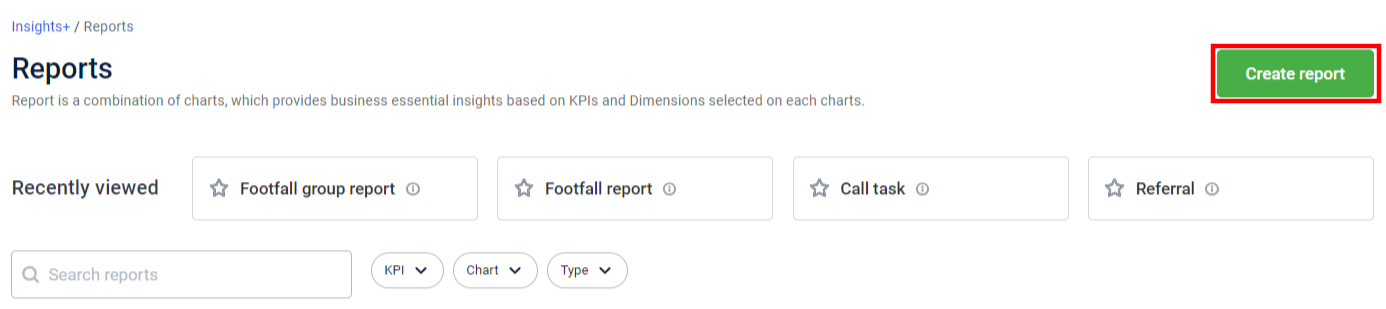
- Click Create Report.
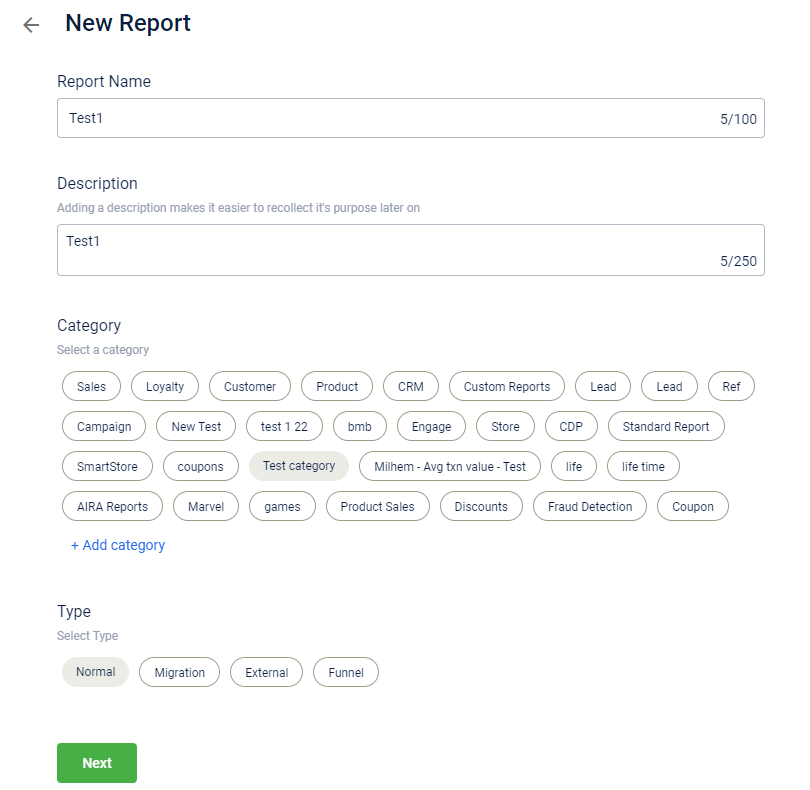
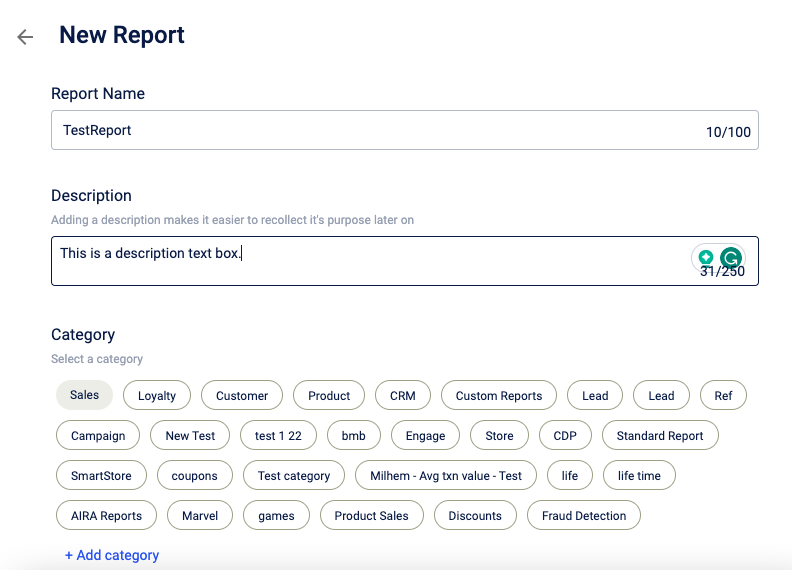
- In Report Name, specify a name for the report.
- Write the appropriate report description in the Description box.
- Choose the report Category . To add a new category, click +Add category.
- Select the report Type from the following options: Normal, Migration, or Funnel. To create an External report, click here.
The type of report depends on the type of chart you choose to add. For example, if you select "Normal" as the report type, you can only add Normal charts. Likewise, to add a Funnel chart, choose "Funnel" as the report type.
- Click Next.
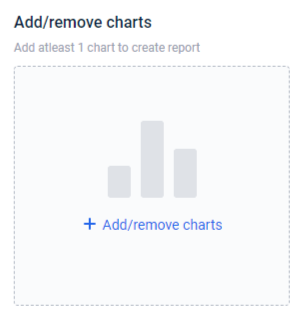
- Click + Add/Remove Charts. You will be directed to the add/remove charts interface.
- Select the chart from the list or search for the required chart in the search box and click Done. If you want to create a new chart, click + Create new chart. To know more on creating charts, click here.
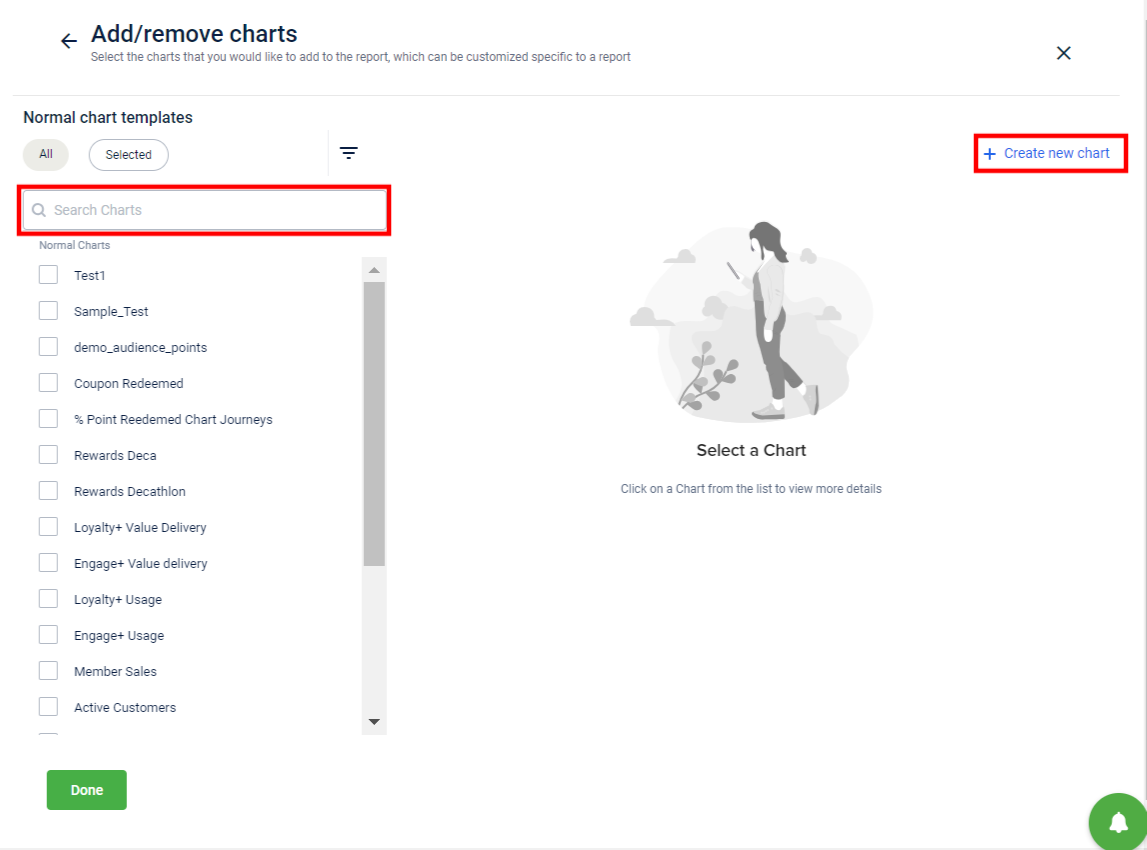
- If you cannot recall the chart name, use the Advanced Filter option. Select the KPIs and Dimensions by expanding the drop-down boxes and click Apply.
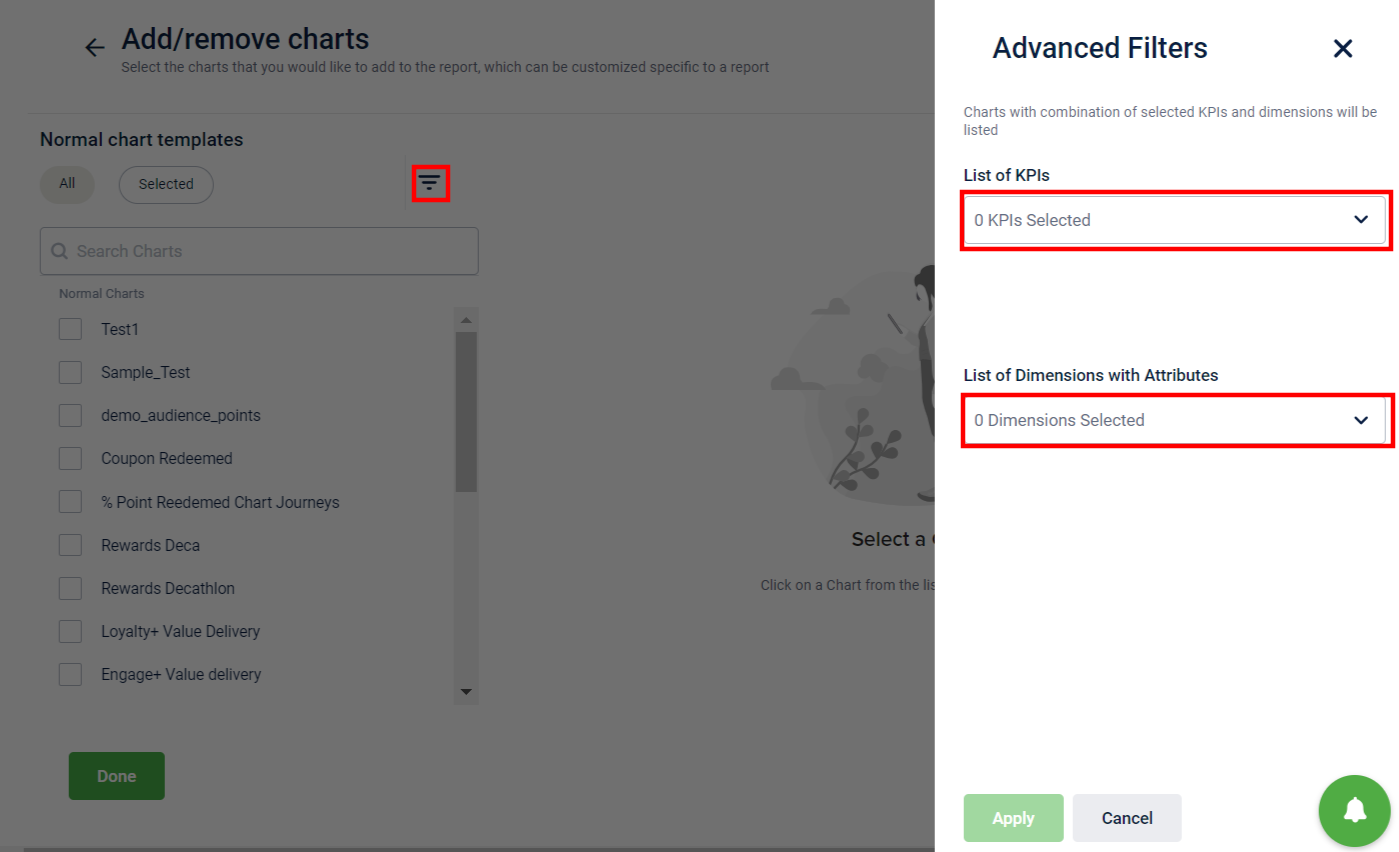
Advanced filters are applicable to Normal and Migration charts only.
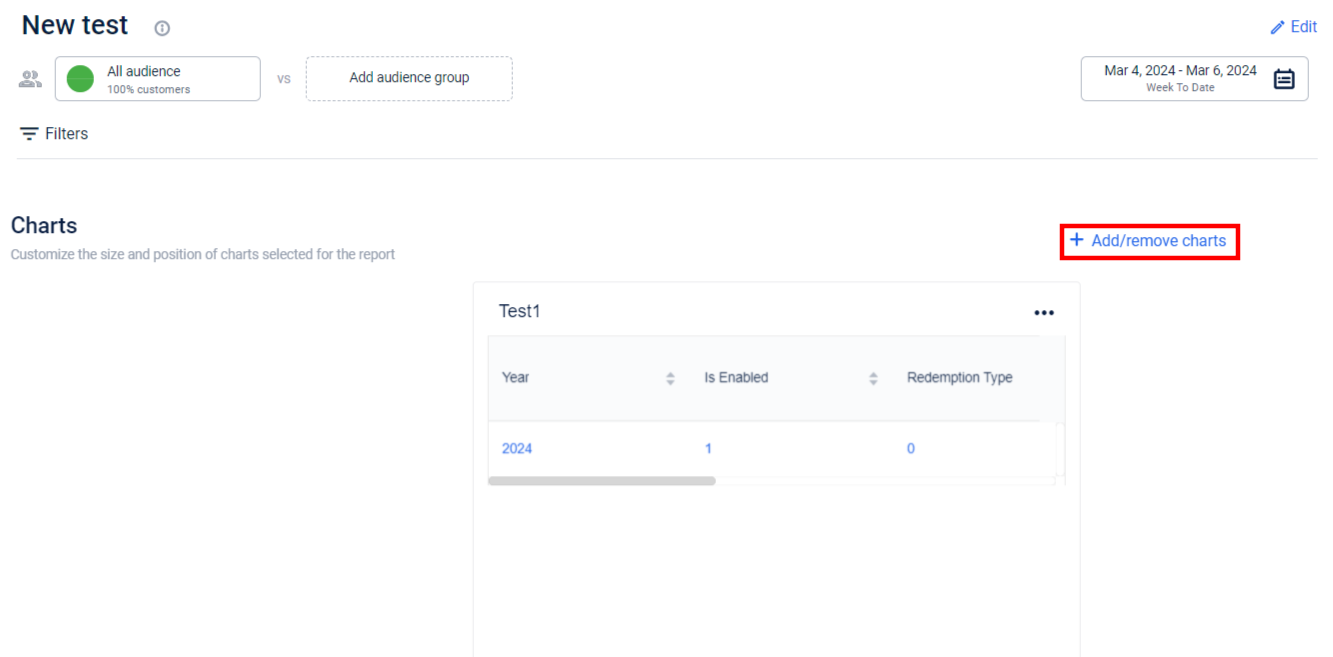
- Click Done. The selected chart is added to your report.
- Click + Add/Remove Chart to add additional charts or remove existing ones from the report.
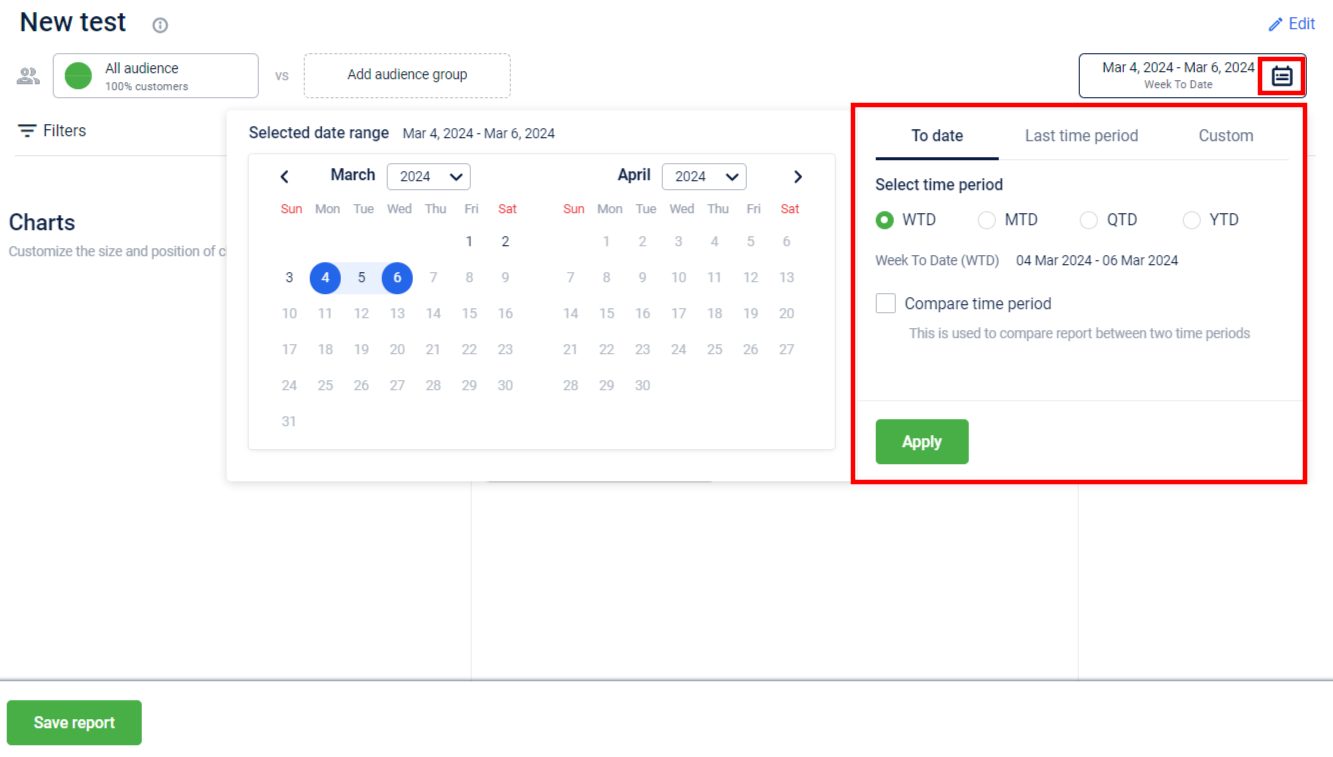
- Click on the calendar icon to select the desired date range for the report. Check Compare time period to compare data of a previous duration, and click Apply. To know more about date filter and comparison with a previous duration, click here.
- Click Save Report.
External Report
Prerequisite:
Databrick notebook access.
To create an External report, perform these steps:
- In the Report Name field, enter a name for the report.
- In the Description text box, enter a description of the report.
- Choose the report Category. To add a new category, click +Add category.
- From the Type, select External.
- In the Report URL, enter the Databricks notebook path.
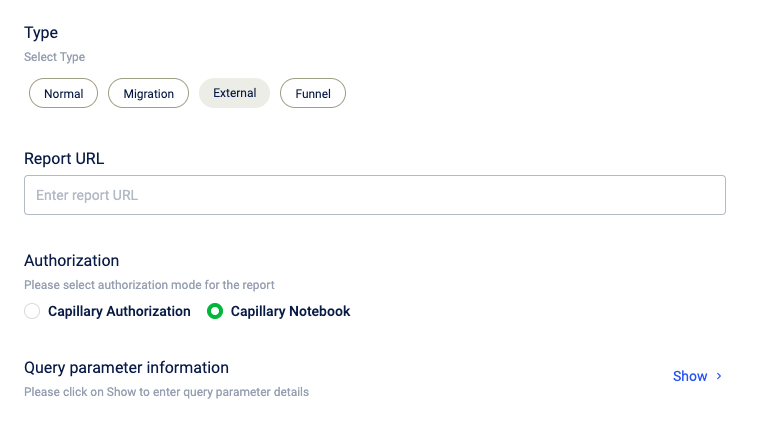
- Select Authorization mode for the report. For third party tool credentials (like Zeppelin, Databricks) select Capillary Notebook. For Capillary Insights+ credentials select Capillary Authorization.
- To enter Query parameter details , click Show.
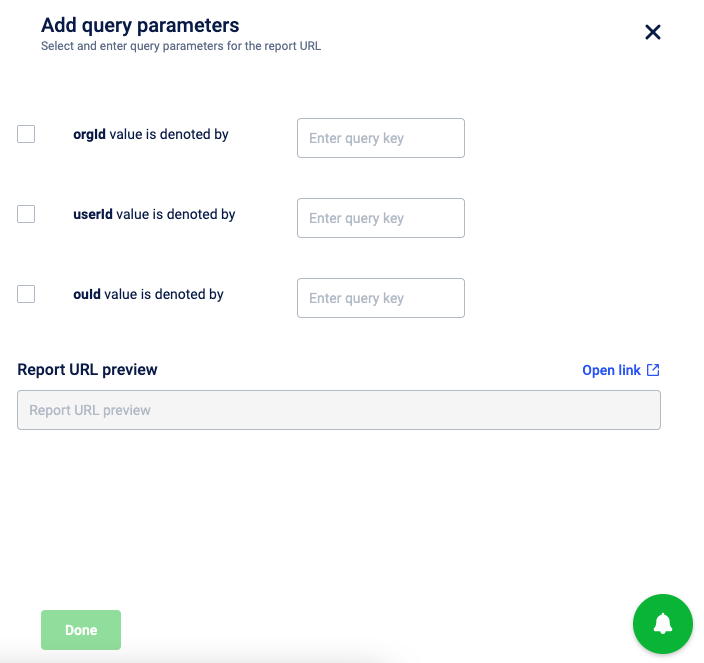
- In the Report URL preview , click Open link to preview the report.
- Click Done.
- Click Next and then, click Save report.
In case of any error viewing the report, verify and update the Databricks report URL link.
Publish report
Upon creating the report, you can see it in the respective category in All Reports. If you want other users of your organization to access the report, you need to publish it manually. Else, only you (creator) can access the report. To publish the report, perform the following steps:
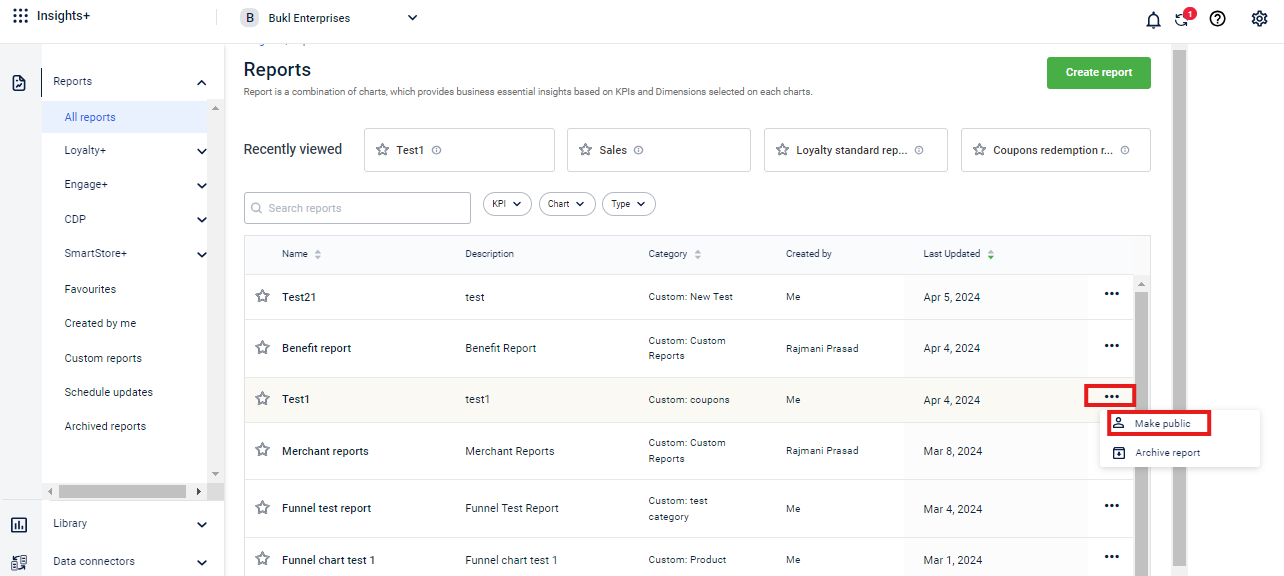
- In All Reports, click the report that you want to publish. Use the Search box and filters to find the desired report.
- Click More options > Make public.
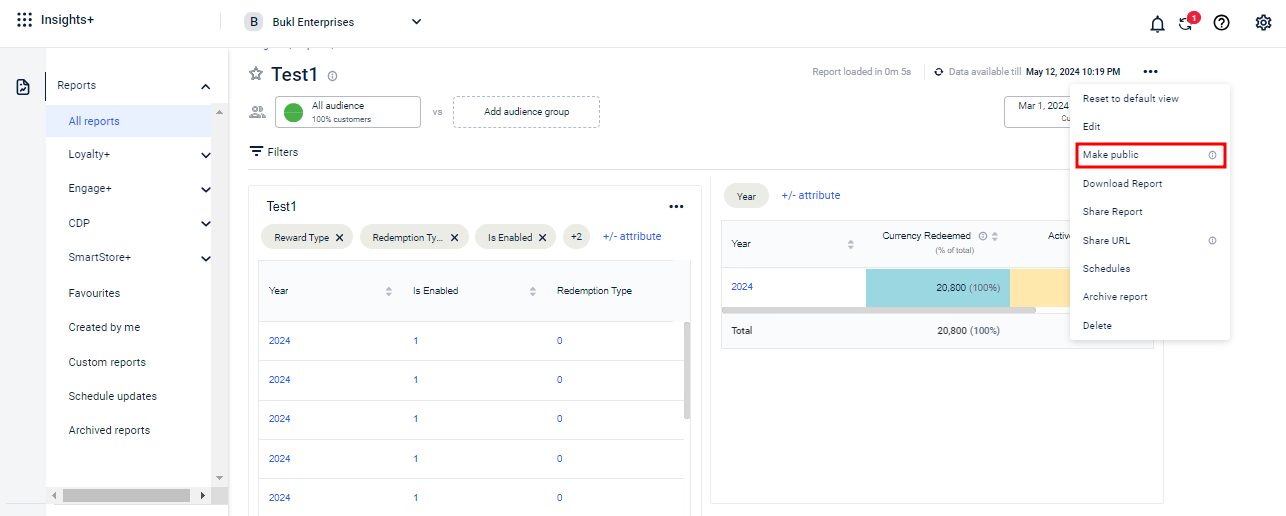
Alternatively, from the reports list, you can click More options of the desired report and click Make public, without having to open the report.
A success message is displayed when the report is published.
Example Scenario: Analysing Badge Earnings
Consider a scenario where a brand wants to analyse the badge earnings of their customers. To support this analysis, a chart has been created in the "Create Charts" section. Please refer to the badges earned chart. In this section, we will add the chart to our report for further analysis.
Follow the steps below to create a report using the badges earned chart:
- Navigate to Insights+ > Reports.
- Click Create report.
- Fill in the Report Name and Description. Select the appropriate Category. Select the report Type as Normal.
- Click Next.
- Click +Add/remove charts.
- Type the chart name or scroll through the chart list to locate the desired chart. In this use case, we will select the Badges Earned chart from the chart list.
- Click Done. The chart gets added to the report.
- Set the report Date range by clicking on the calendar icon. In this report we are selecting the report date to contain data for the last 1 year. Click Apply.
- The chart having the desired KPIs and dimensions in the specified date range, gets populated. Click Save report.
Key Insights from the Badges Earned Report
Majority Engagement from Lower Tiers
Customers in lower sales ranges, especially the Base tier, account for nearly 80% of all badge earnings, indicating strong engagement at the lower end of the loyalty spectrum.
Peak Engagement Period
June 2024 has a high number of badges earned, suggesting successful campaigns or promotions during this time, particularly among Base and Silver customers.
Low Engagement in Premium Tiers
Higher-tier customers, such as those in Gold and Platinum, contribute significantly fewer badges, indicating a need for strategies to increase engagement.
Opportunities for Re-engagement
Badge earnings are minimal in certain tiers, contributing only 1% or less, signalling an opportunity to re-engage these customers with targeted efforts.
These insights suggest focusing on maintaining base tier engagement while improving badge earning in higher tiers.
Updated 5 months ago