
Neo Debugging Extension
The Neo Debugging Extension is a browser extension designed to help you with the debugging process for Neo dataflow executions within Capillary. It offers multiple monitoring tools for Neo dataflow's.
Hidden as per instructionsThis page is hidden because the contents is about the Neo Debugger. This is a chrome extension that is private and available only for capillary users.
Key benefits and features:
- Real-time Request Inspection: Monitor dataflow executions with detailed timelines and request/response logs.
- Block-Level Input/Output Visibility: Gain clear visibility into the data flowing into and out of each block within your Neo data flows.
- cURL Import Support: Easily share and reuse API calls across development teams.
- JavaScript Engine: Execute basic JavaScript functions directly within the extension to inspect response structures.
- Log Management: Clear, preserve, and search logs for efficient debugging.
- Data flow Navigation Support: Easily navigate to open dataflow's by clicking the neo debugger extension icon in your browser's taskbar, revealing a list of active Neo dataflow tabs for direct access.
- Theme: Change the theme of your extension by clicking the toggle button between dark and light
Supported browsers
The Neo Debugger Extension is supported in all Chromium-based browsers.
| Browser | Supported |
|---|---|
| Chrome | Yes |
| Edge (Chromium) | Yes |
| Brave | Yes |
| Firefox | No (Planned) |
Using the debugging extension
To use the Neo Debugging Extension, perform the following:
- Step 1: Install the Extension
- Step 2: Set Up Authentication for the API
- Step 3: Run the Debugger
- Step 4: Review Logs and Inspect Data
Step 1: Installing the extension
To install the Neo Debugging Extension, do one of the following:
-
For Chrome users:
-
Navigate to Chrome Extension.
-
Click Add to Chrome.
-
Confirm the installation when prompted.

-
-
For other Chromium-based browsers:
-
Open the link in a Chromium-based browser (Chrome, Edge, Brave).
-
Click Add extension.
-
Confirm the installation when prompted.
-
-
Install from Dev Console:
- Navigate to Dev Console > Neo Debugger (from the left navigation pane).
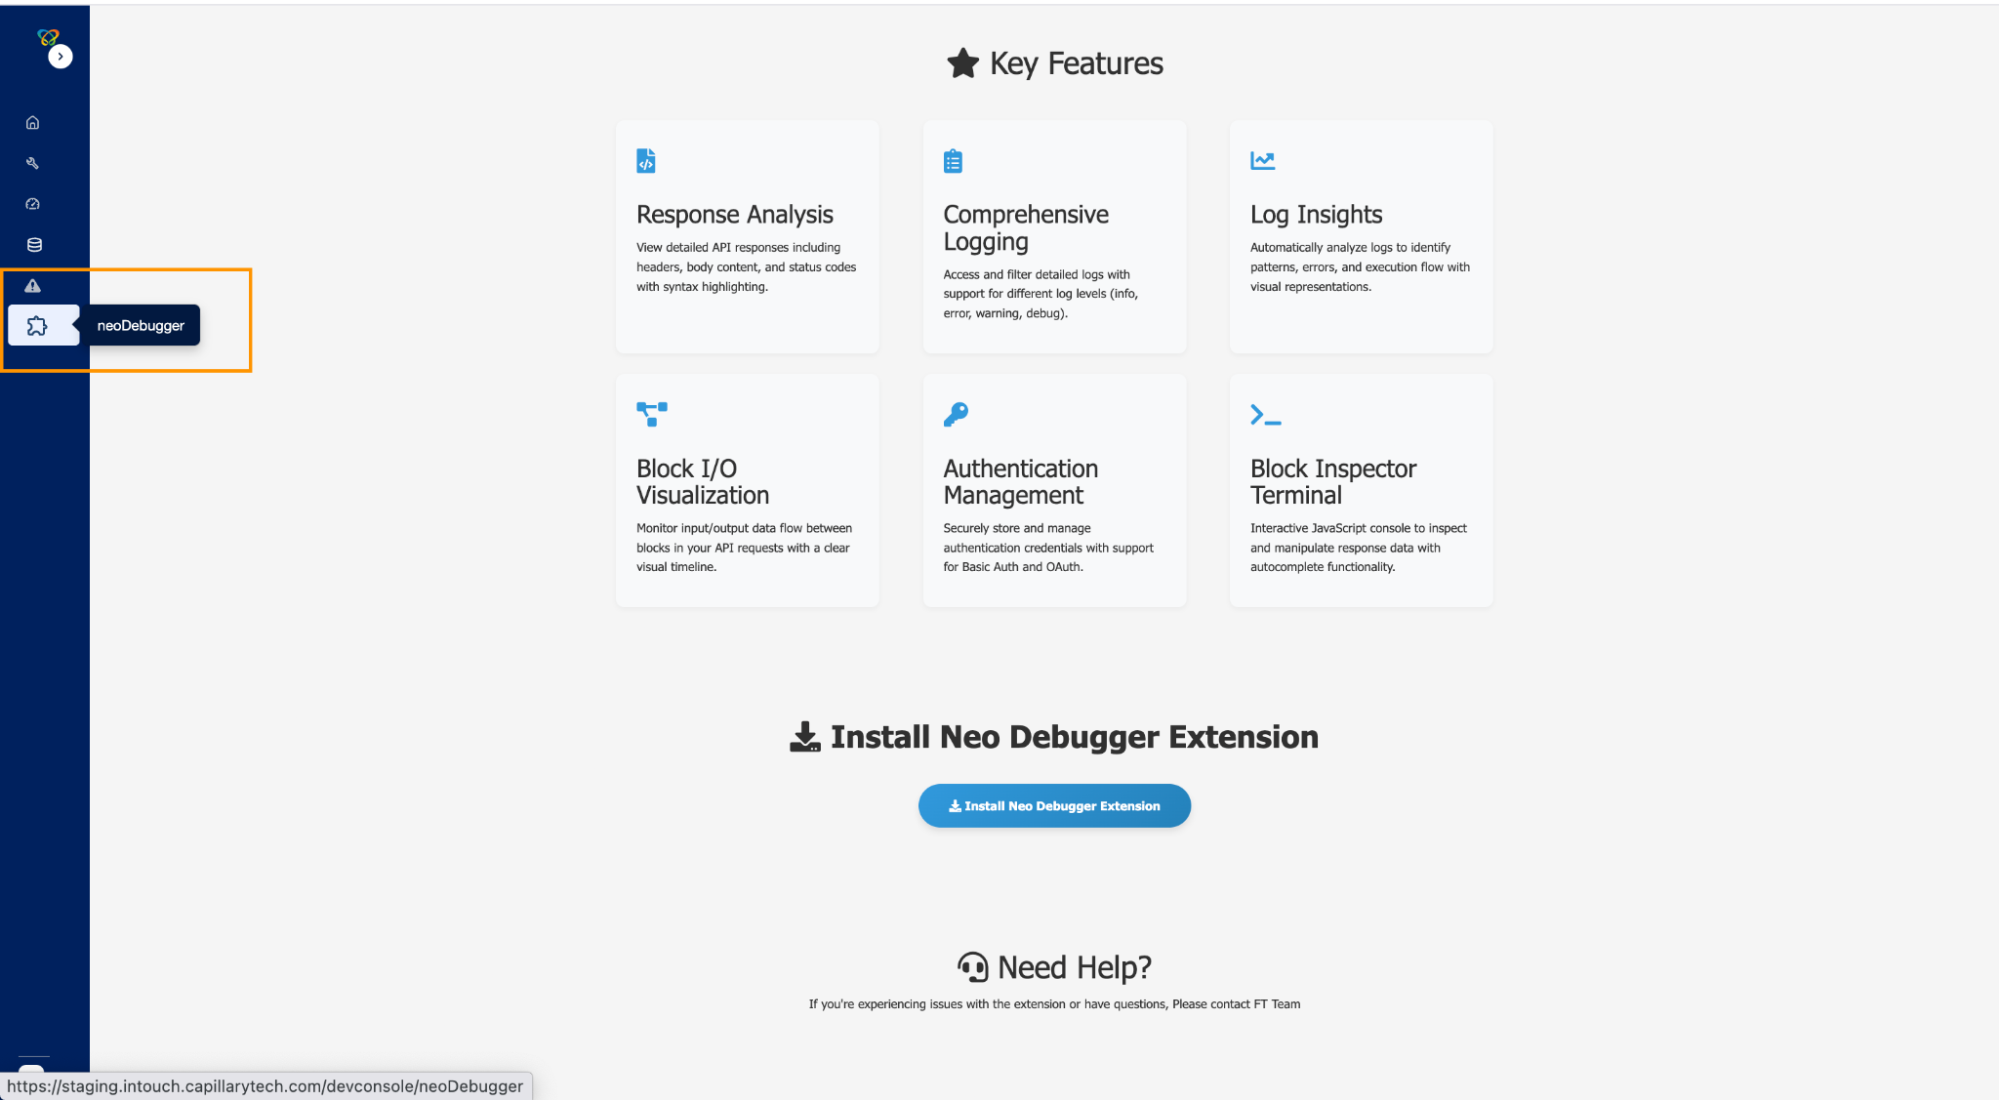
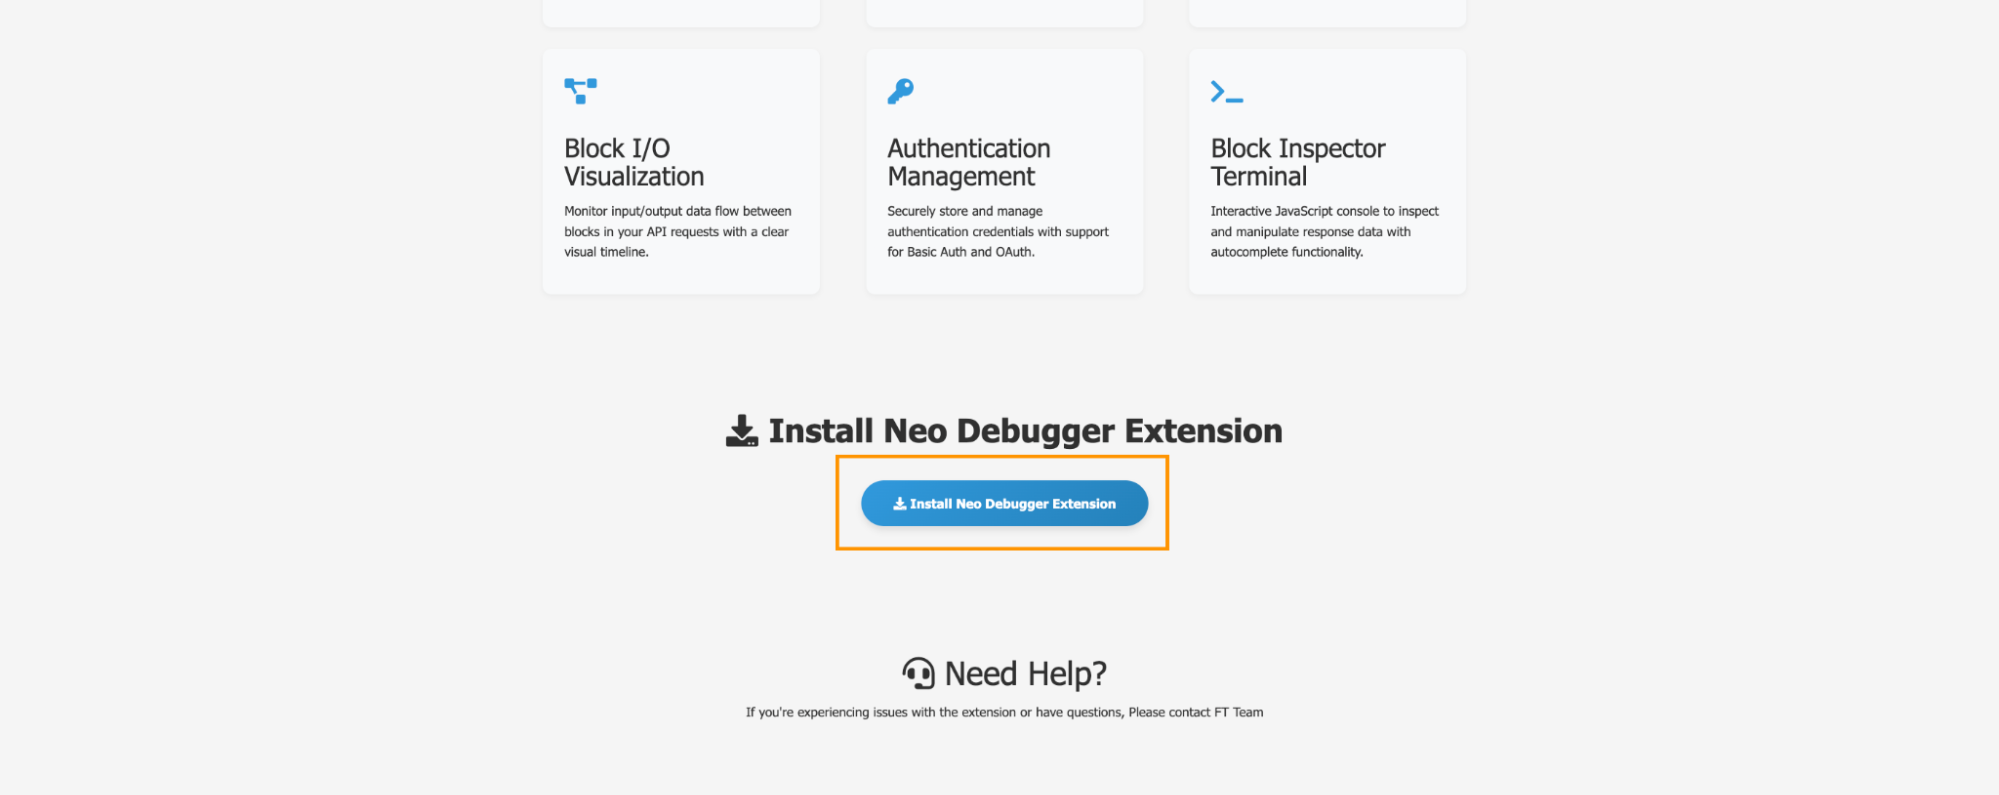
- Click the Install Neo Debugger Extension icon.
- Click Add extension.
- Confirm the installation when prompted.
Note: This extension is unlisted and is specifically designed for Capillary users. If you add the extension again, multiple Neo Debugger tabs will appear in the Developer Tools section of your browser.
Step 2: Set up authentication for the API
To set up the authentication, perform the following:
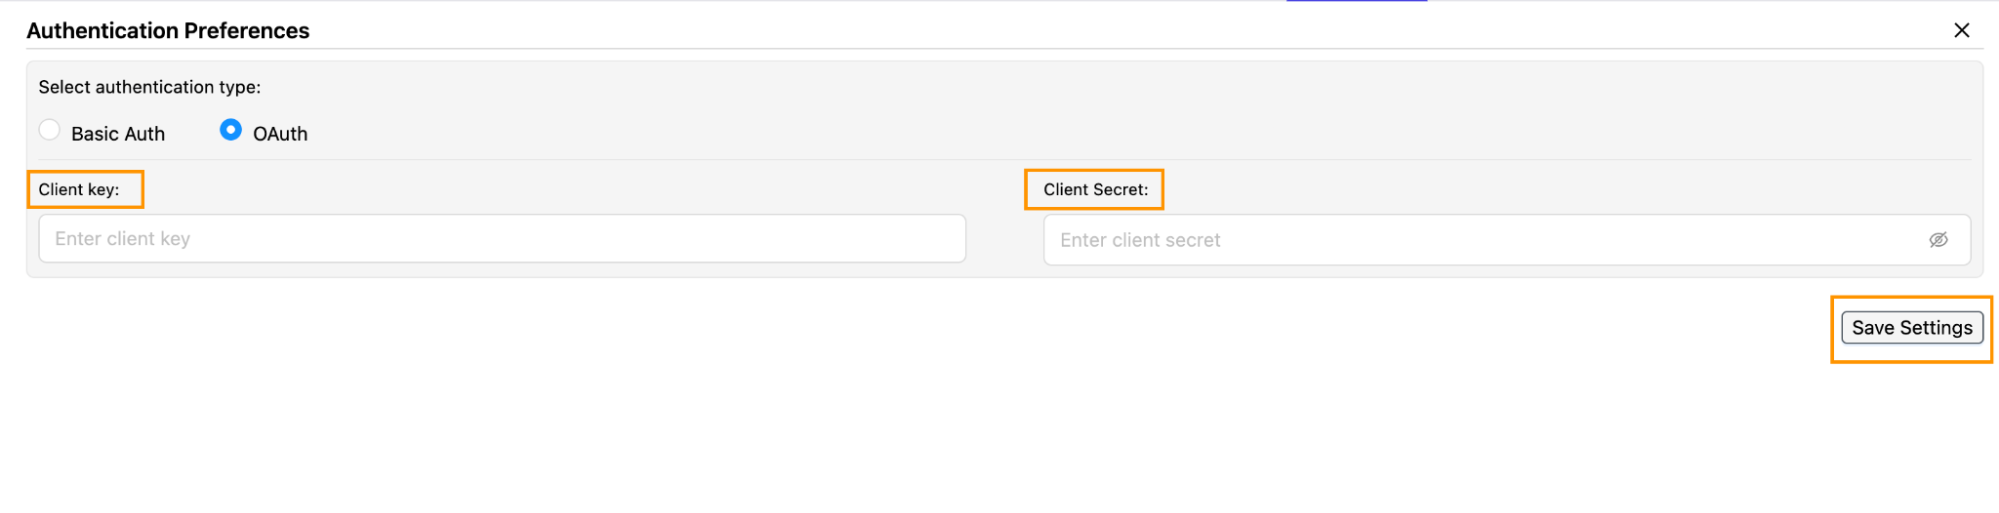
- Navigate to Neo Debugger > Settings icon > Authentication Preferences.
- Choose an authentication method.
- Basic Auth: Enter your basic authentication token.
- OAuth: Generate a client and key, then enter the required OAuth details.
All values are synchronized with the Secret Manager. Once approved, the configuration is saved.
- Click Save Settings.
Step 3: Running the debugger
The debugger starts automatically when you test the dataflow. To do this, click the Test Dataflow icon in the Neo Debugger tab.
Step 4: Review logs and inspect data
After running the debugger, you can review logs and troubleshoot issues. This section explains the purpose of each tab and how to use them during your debugging process.
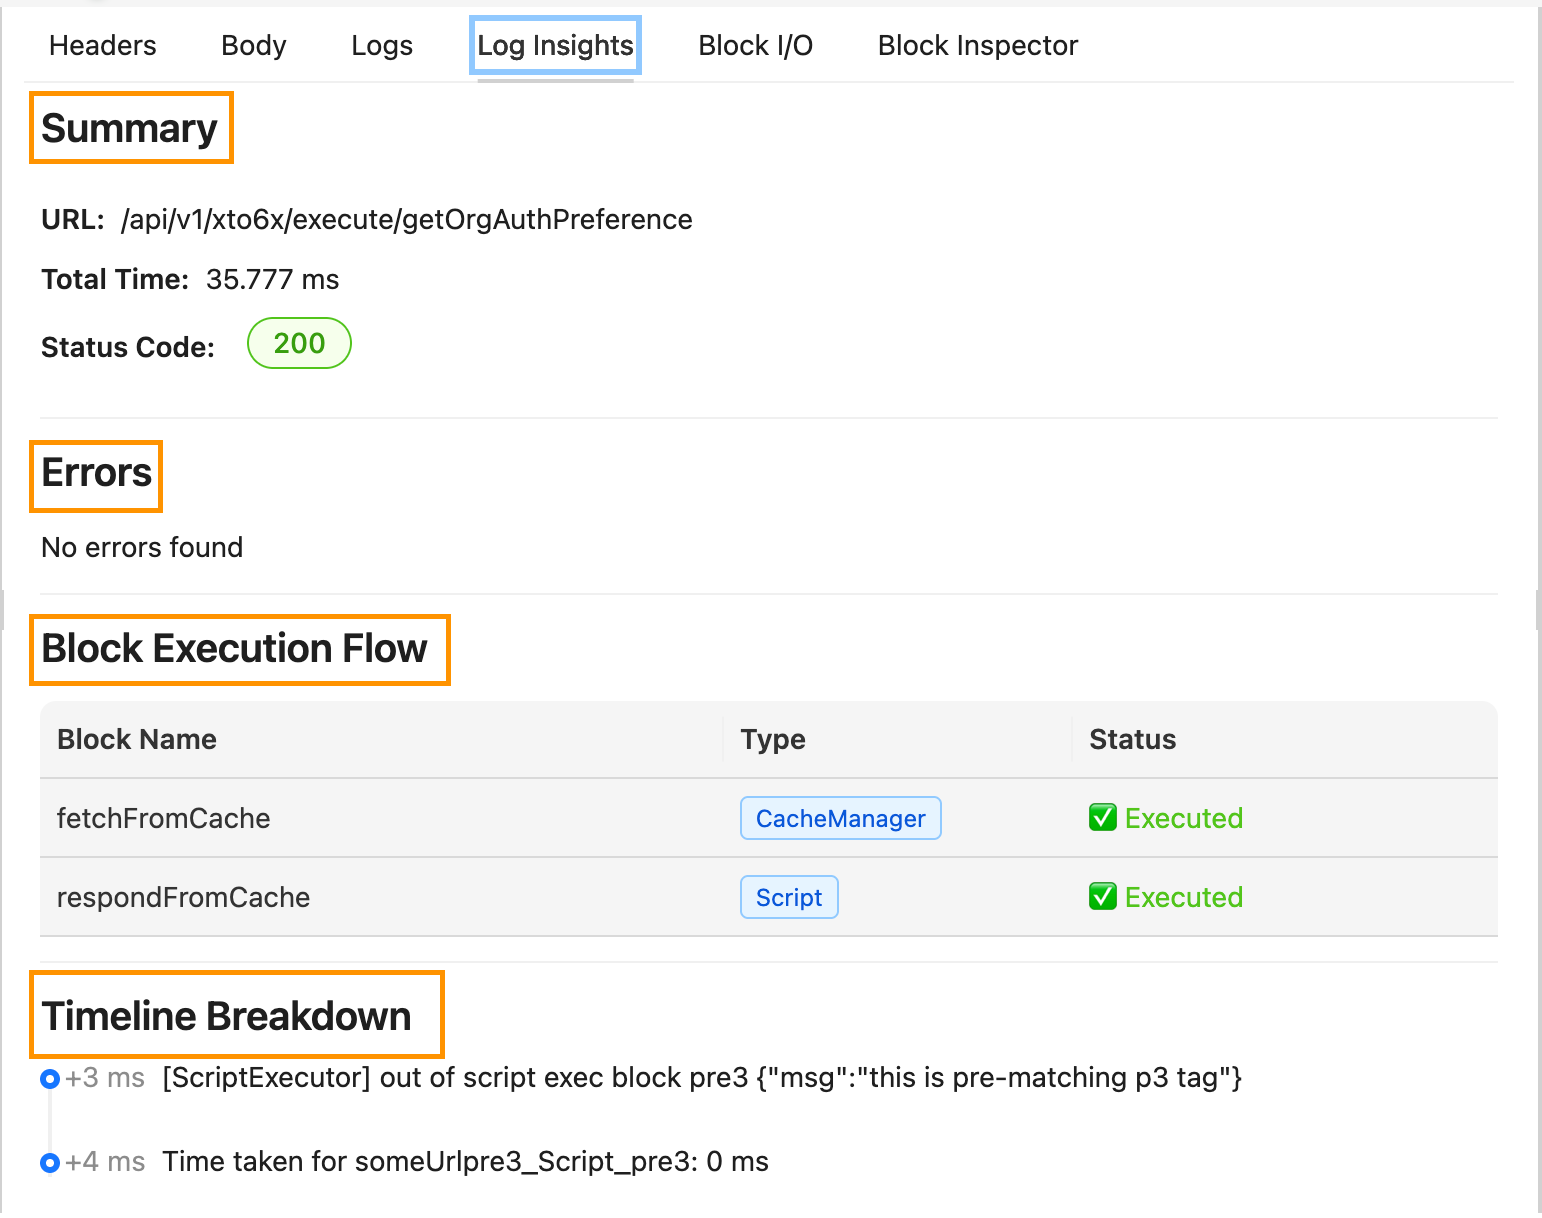
Log Insights Tab
This tab provides summary details, block execution flow type and status, and a time-stamped timeline of the execution events.
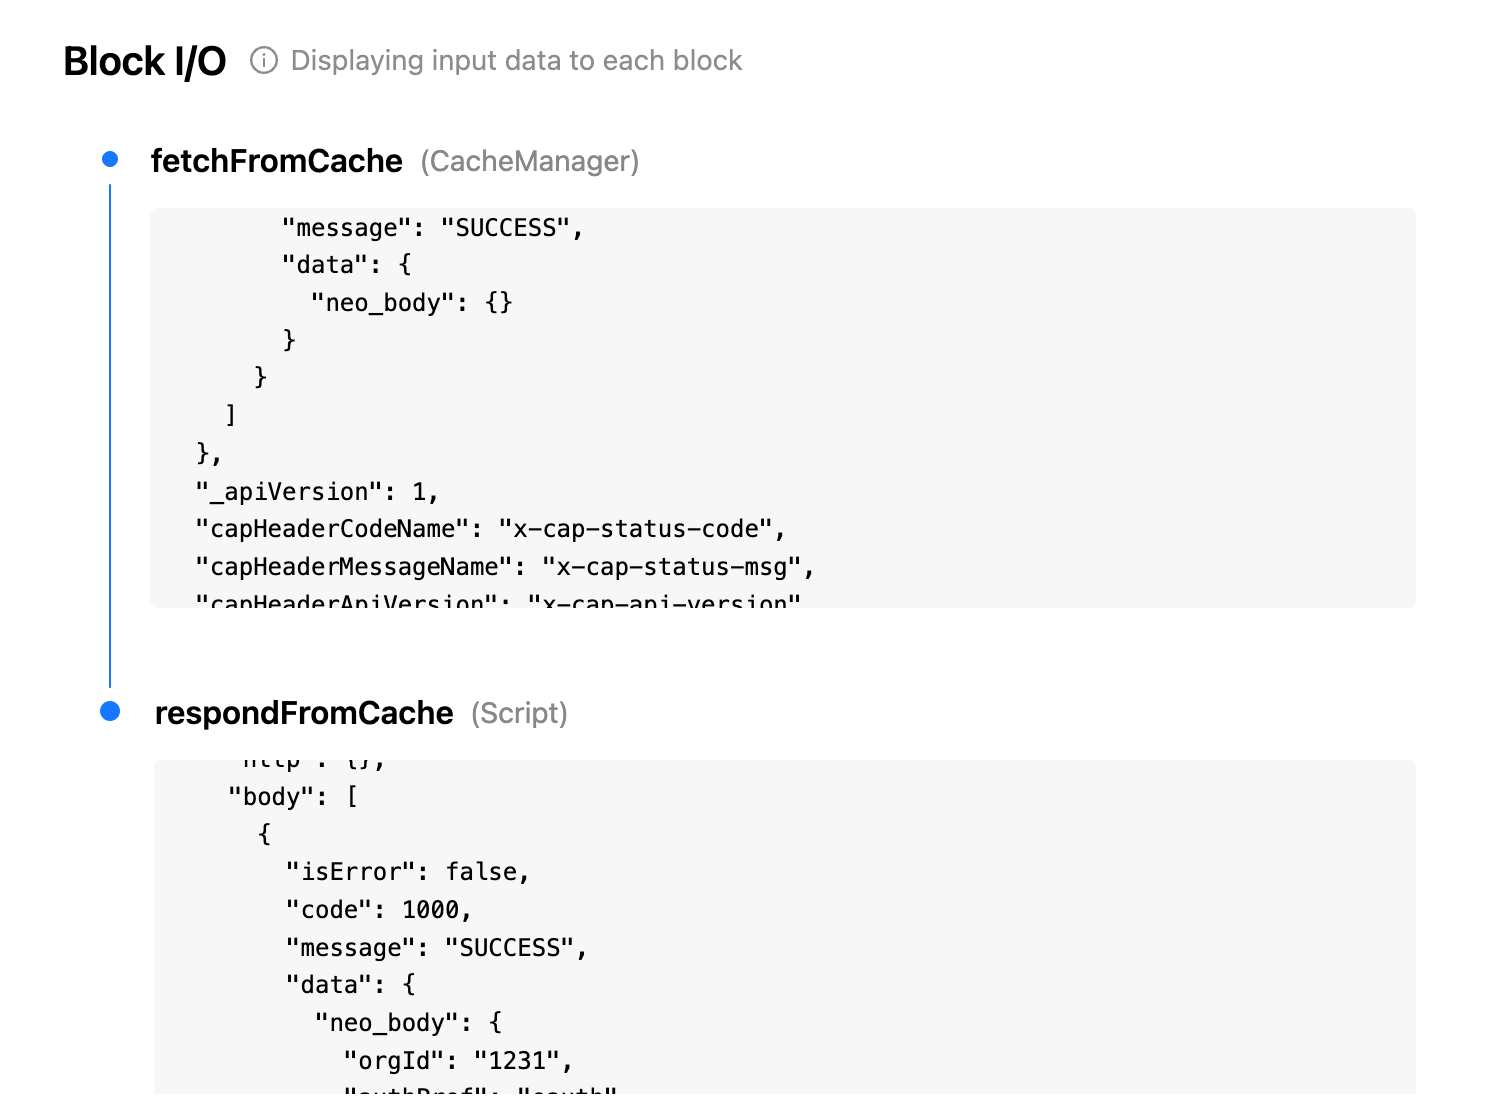
Block I/O Tab
This tab provides detailed information on input and output data for each block in your dataflow execution.
Block Inspector
This tab allows you to run basic JavaScript operations, such as getBody(), directly on the response data of any block. For example, you can run dao.getBody() to view a block's body content within the response.
Manage logs
You can use the options below to preserve, search, and clear the dataflow execution log.
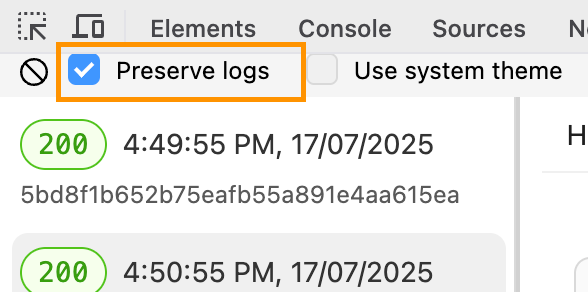
- Preserve Log: Toggle this option to retain logs across executions. When disabled, the log clears with each new run.
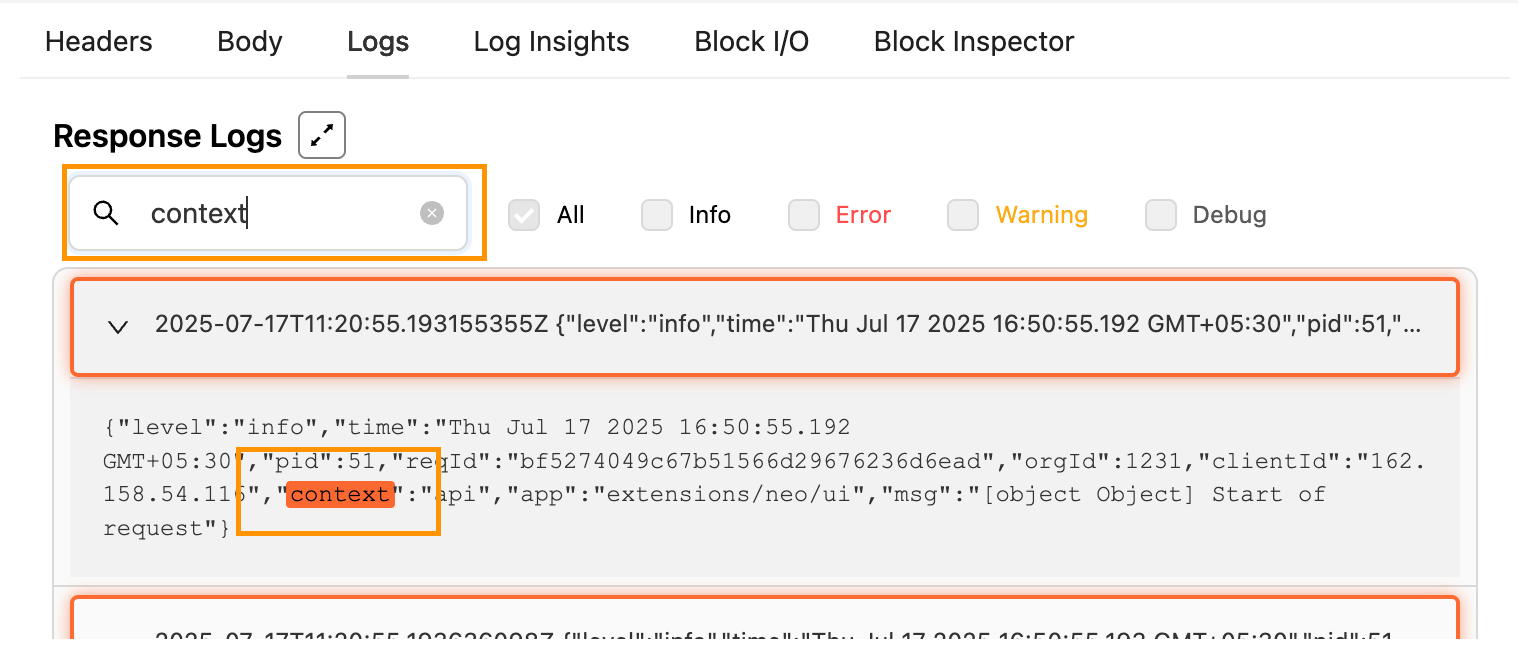
- Search and Highlight: Enables you to search and highlight specific entries within the logs for quick analysis. For example.
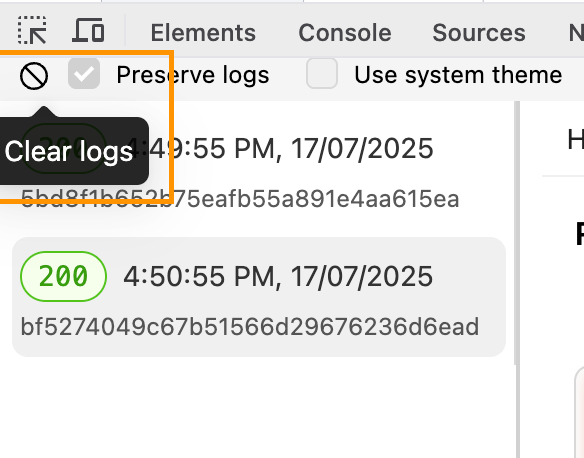
- Clear Log: Enables you to clear all previous log entries. To proceed, click the Clear Log icon. Once these entries are cleared, they cannot be recovered.
Import calls
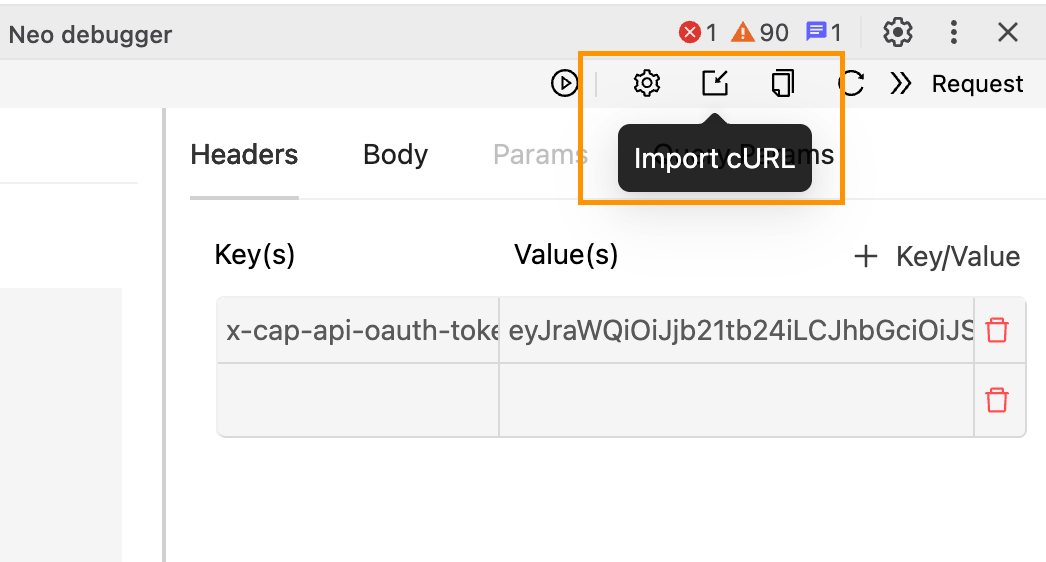
This feature allows you to import a cURL and test the dataflow. This is useful when multiple developers are working on the same dataflow. The cURL shared by one developer can be imported by another and tested. To import a cURL, perform the following:
- Navigate to the Import cURL icon within the Neo Debugger Extension.
- Paste the cURL command in the input text box.
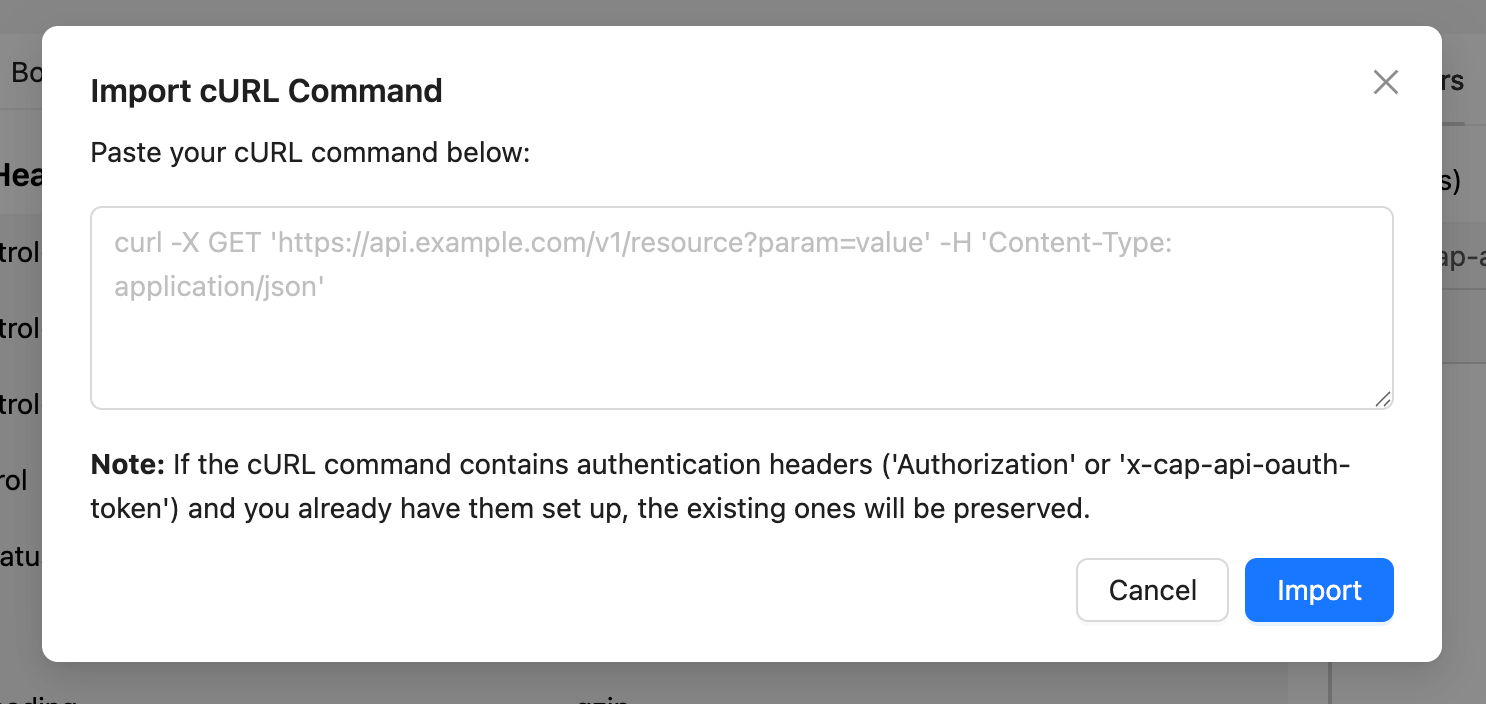
- Click Import.
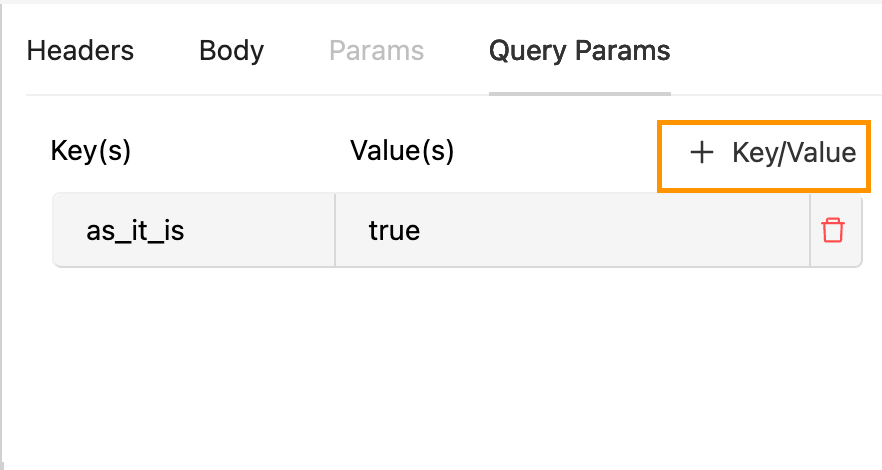
Additional Header, Body, and Query Parameters
If required, you can add headers, body, and parameters. Use the key-value input fields to set custom headers for your requests. Path and query parameters will automatically be populated if present in the URL.
Troubleshooting
| Issue | Solution |
|---|---|
| Extension not visible | Ensure you are on a Neo DAG page within Capillary. |
| Authentication not working | Check the token format, regenerate credentials if necessary, or verify OAuth details. |
| Logs not retained | Enable the "Preserve Log" option. |
| Import not working | Verify that the Postman cURL call format is correct and valid. |
Updated 18 days ago