
Block-Level Reporting in Journey
The Journey Block Level Reporting feature provides detailed insights into the performance of individual blocks within a journey. This enhanced reporting capability helps you to understand how each block is performing and enables you to take action if required.
Notes
By default, this feature is not available for all the orgs. You need to raise a Jira ticket to the sustenance team to enable the feature for your org.
Journey View Report data is available only after a one-time Insights onboarding is completed for your organization. This setup is not automatic and must be explicitly requested.
Until onboarding is completed, the report shows 0 entries even when customers have entered and progressed through the journey.
To enable reporting, raise an onboarding ticket to the Insights engineering team.
This is a one-time setup per organization. Once completed, reporting will reflect actual journey data going forward.
Type of KPIs in the report
The application fetches different types of KPIs, depending on the blocks used in the journey:
- Basic channel measures such as Sent, delivered, clicked and opened (wherever applicable)
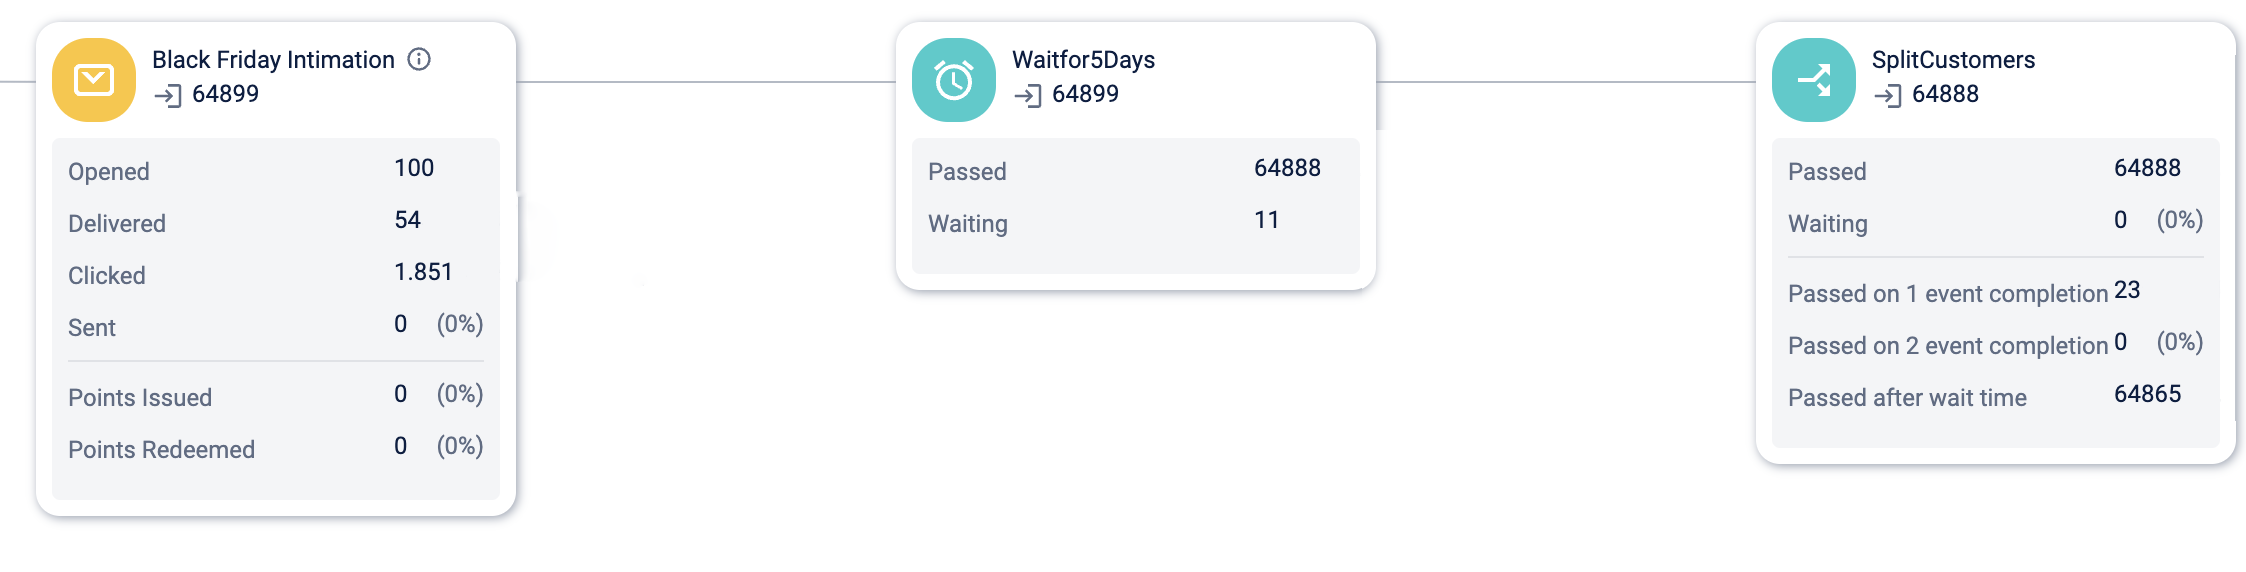
- Basic journey measures such as the number of customers who entered a block, number of customers who exited the journey, number of customers waiting in a wait block and so on
- Incentives measures - Issued and Redeemed
NotesA journey report will be available 24 hours after the Journey goes live. This is based on the ETL sync time as it is based on the date from the Insights backend.
Viewing a report
To view a report of a Journey, perform the following:
-
From the Journey listing page, open the journey for which you want to see the performance report.
-
Turn on the View report toggle switch. The report is displayed for the individual blocks.
-
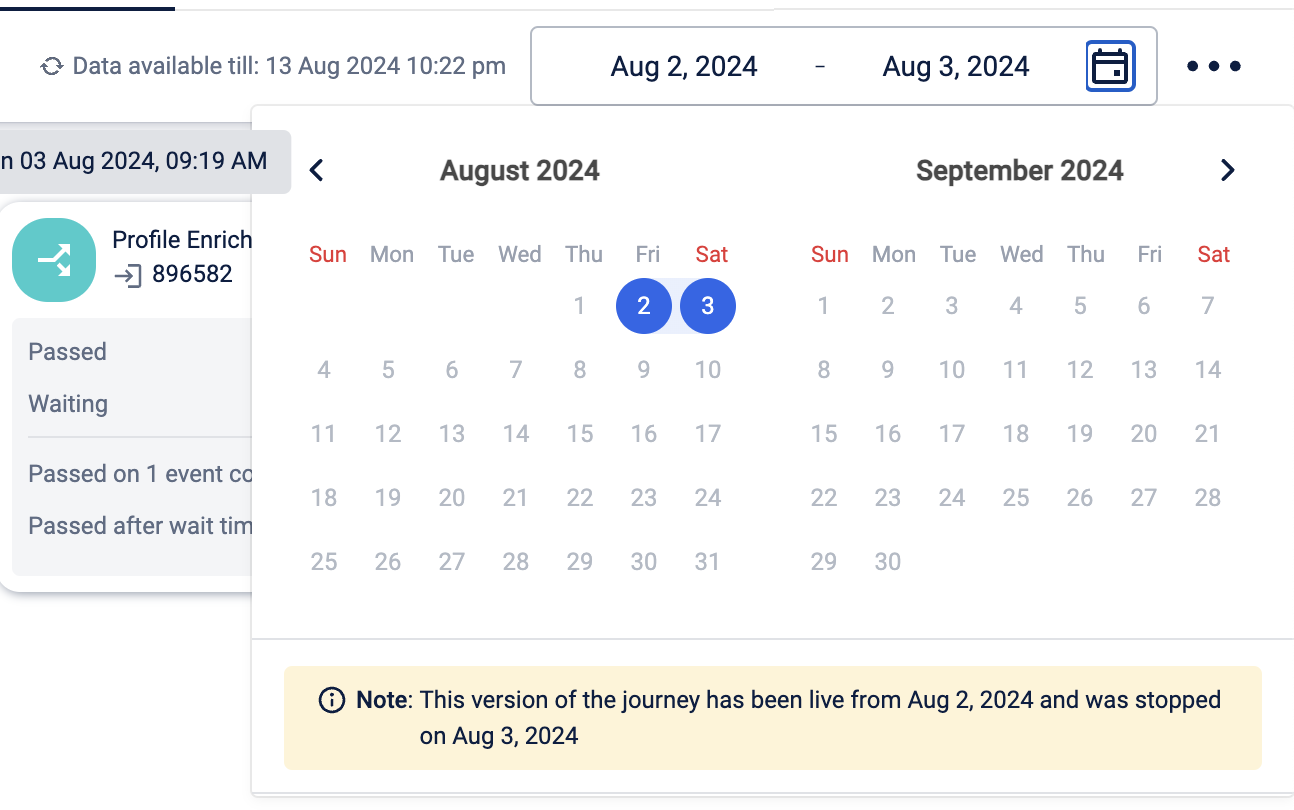
You can use the date filter the performance date based on the date range. The maximum duration of a report is not limited, but you can adjust the date range as needed. Refer to section Using date filter.
-
From the meat-ball menu, click the Reset to default view to reset the view.
Viewing A/B testing block performance
To review A/B testing block performance in a journey report, follow these steps:
-
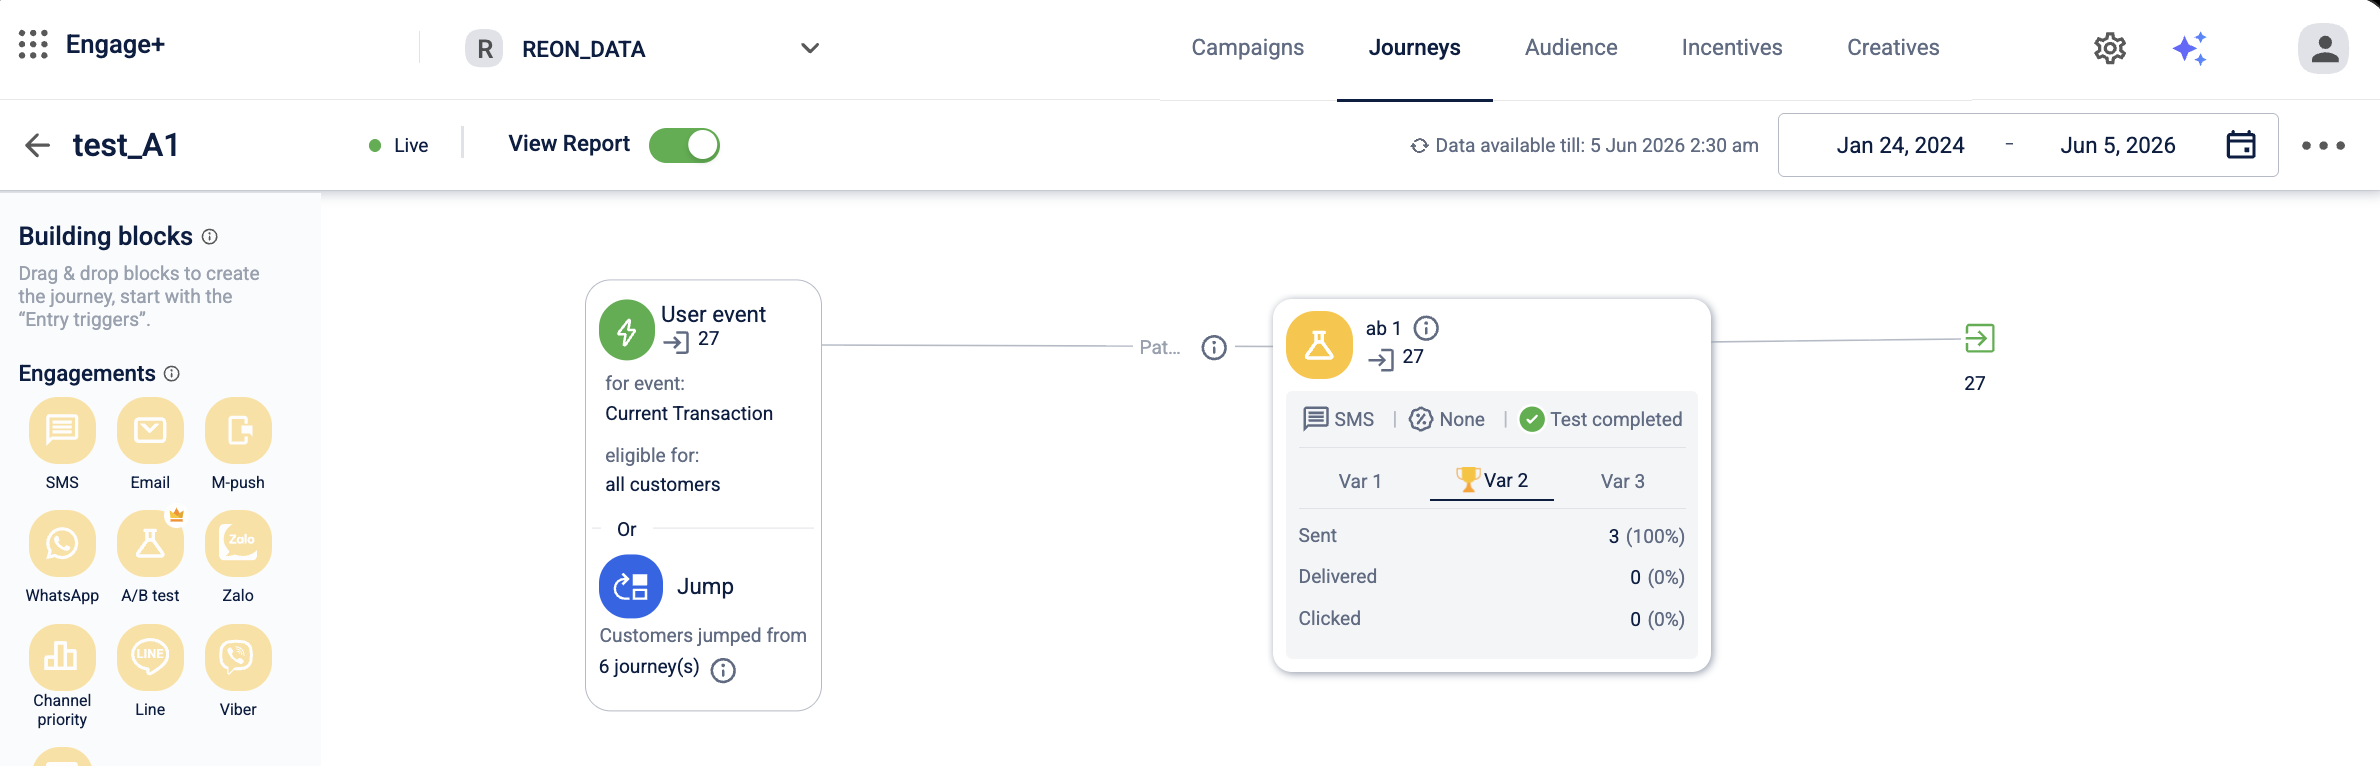
Turn on View report for a journey that contains an A/B testing block. The block shows one tab per configured variant, labeled Var 1, Var 2, Var 3, up to the number of configured variants.
-
Select a variant's tab to view its KPIs: Sent, Delivered, and Clicked, each shown as a count and a percentage.
-
Check the status strip above the tabs for the engagement channel, the incentive type (Points, Offers, or None), and the test status: Test running, Test completed, or Test error.
-
Look for a trophy icon on a variant's tab to identify the winning variant.
-
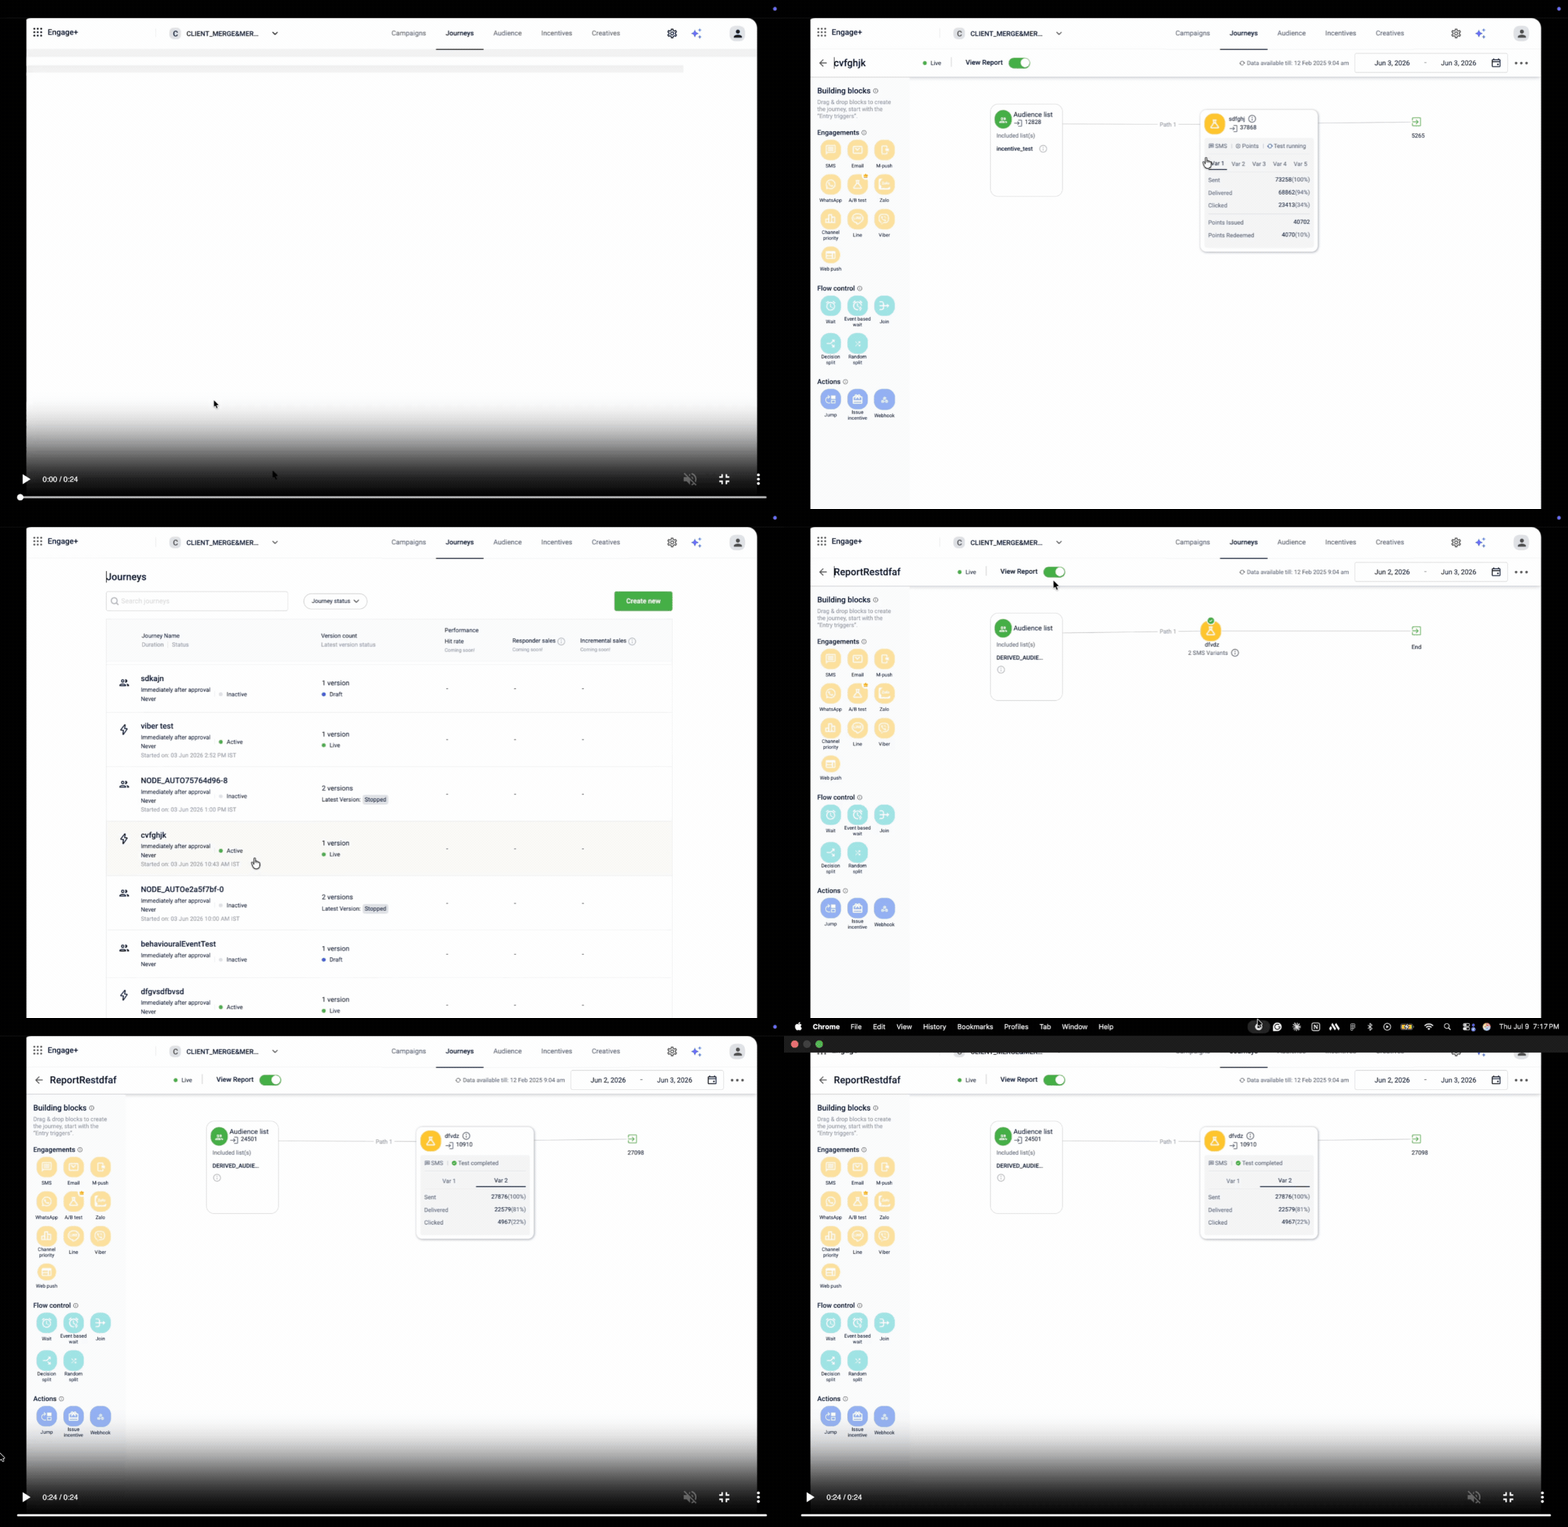
If you select a different variant as the final one, look for a checkmark icon on that variant's tab instead. The status strip disappears once you select a final variant.
-
If the variant uses an incentive, check the issued and redeemed counts for points, coupons, or cart promotions and gift vouchers, shown below the KPIs. For badges, these show as issued and earned counts.
Using date filter for report
The date filter allows you to view the report for a desired date range. Below are the features of the date filter:
- The default date range for the report is from the date the journey went live until the current date.
- You can alter the date range for the report by changing the start and end dates.
- When you open the report mode, the application displays relevant data based on the selected version. For instance, if you have two versions of your journey and Version 1 spans from August 2 to August 3, the application will display the report for that specific duration when you open Version 1.
Updated 7 days ago