
Analyse dataflow performance
This page provides you with information on analysing the performance of the dataflow created.
After a dataflow starts running, you can click on a particular dataflow and analyse its performance.
NoteBy default, the system displays data from the last 24 hours. You can filter the dates and the view data for a maximum of 30 days.
Viewing overall performance and error summary
To view the overall performance, blockwise performance and error summary, click on the dataflow from the homepage and then select the Performance tab.
The Performance tab displays the following:
- Overall performance information
- Block-wise performance information
- Error summary
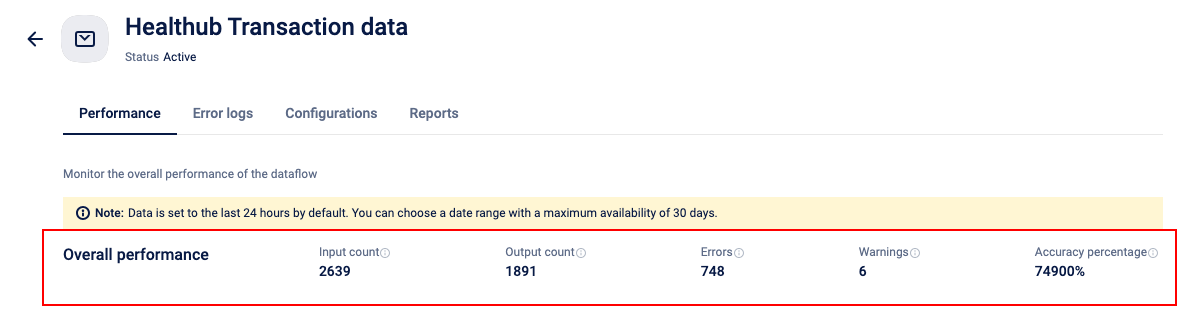
Overall performance
This section gives you a brief about the overall performance of the dataflow.
- Input count - Displays the total number of records added.
- Output count - Displays the total number of records processed successfully.
- Error - The number of errors that occurred.
- Warning - The number of warnings occurred.
- Accuracy percentage - The success rate as a percentage. This is calculated as output count divided by input count, multiplied by 100.
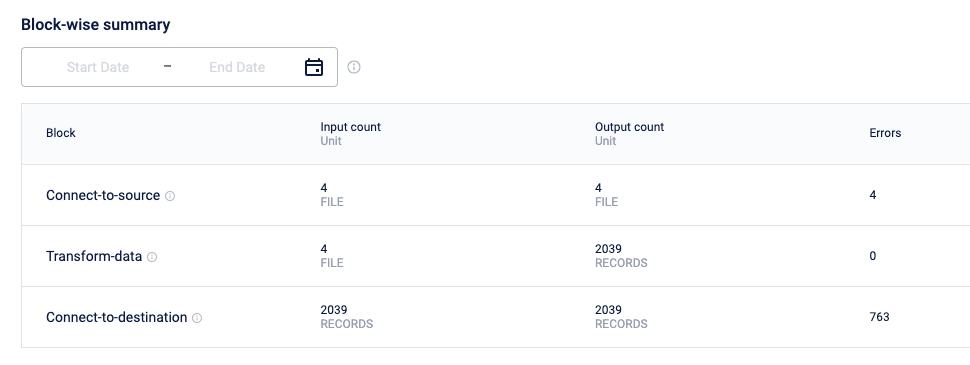
Block-wise performance
This section provides a brief overview of the performance of the dataflow blockwise. You can select the start date and end date of a dataflow and filter the results. Each block is listed separately and displays the following information:
- Input count: The total number of files or records added in the respective block.
- Output count: The total number of files or records processed successfully in the respective block.
Error: The total number of errors that occurred in the respective block. - Error - The number of errors that occurred.
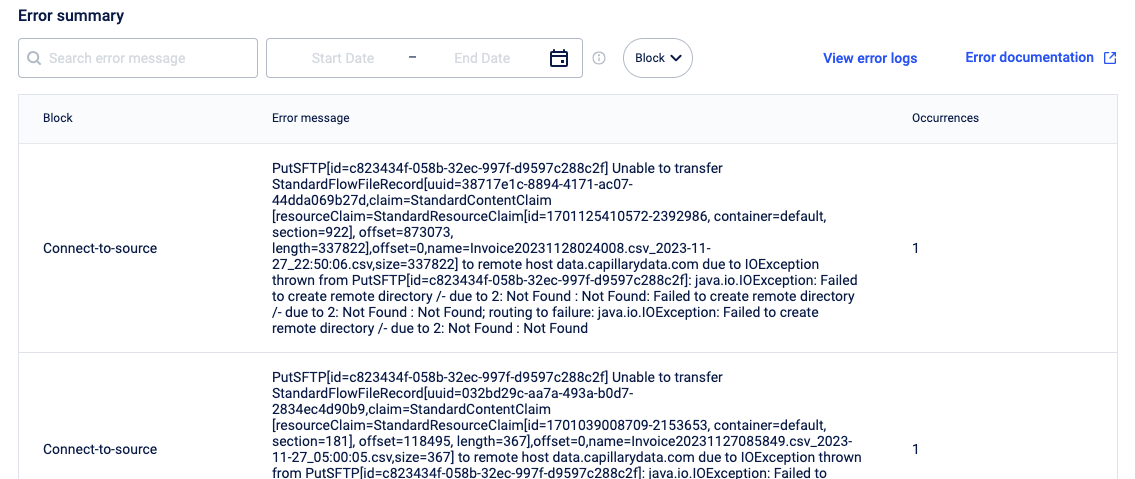
Error summary
This section lists errors along with the error message, the block in which the error occurred, and the number of times the error occurred.
You can use the search option to find an error by its error message and also filter with date on which the dataflow was created. Additionally, you can use the block drop-down to view errors block-wise.
Click View error logs to navigate to the Error log tab and view the error logs in the FTP location. For troubleshooting errors, click Error documentation to refer to the troubleshooting guide.
You can also view the dataflow report from the Error log tab directly. Refer to the documentation on viewing dataflow report.
Viewing dataflow error report
To view the dataflow error reports, perform the following steps:
- Click on the Error logs tab. By default, the tab displays the data of the last 24 hours. To view the previous reports, click the calendar icon and select the dates. Data is available for the previous 30 days.
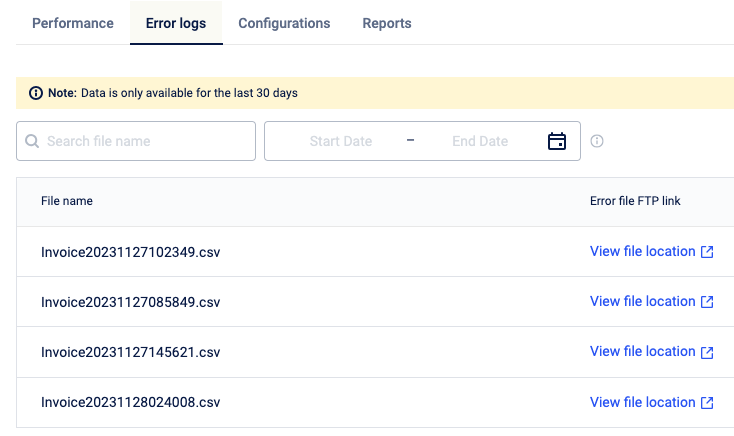
- If you know the error report name, enter the file name in the search box. Otherwise, navigate through the list of error report files and click on the Error file FTP link.
The system will open the FTP location of the error report. Access to the FTP location is required to view the file.
Scheduling and sending reports
To schedule and send a dataflow summary report, perform the following steps:
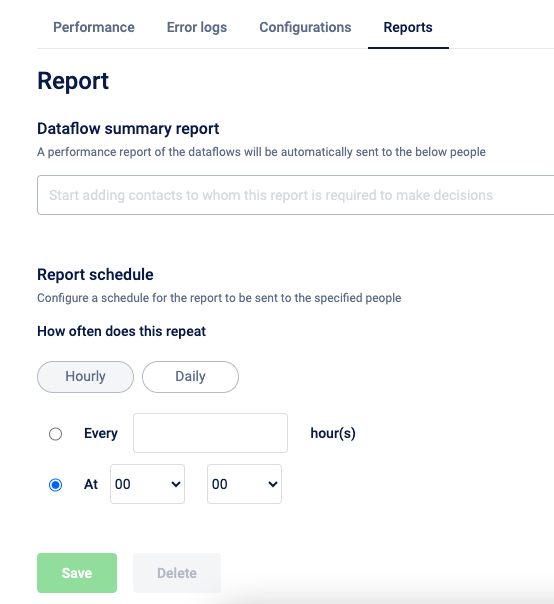
- Click Reports tab.
- Enter the email IDs of the contacts you wish to send an automatic summary report of the dataflow.
- In the Report schedule, enter a schedule for the report to be generated and sent. You can schedule the report to be sent hourly, daily, at every defined hour or at a specified time.
- Click Save.
The dataflow reports will be emailed to the email IDs.
Updated 5 months ago