
View or Access Report
Viewing reports
To view or access a report, perform the following:
- From the home page, navigate to Insights+. Click on Home > Insights+.
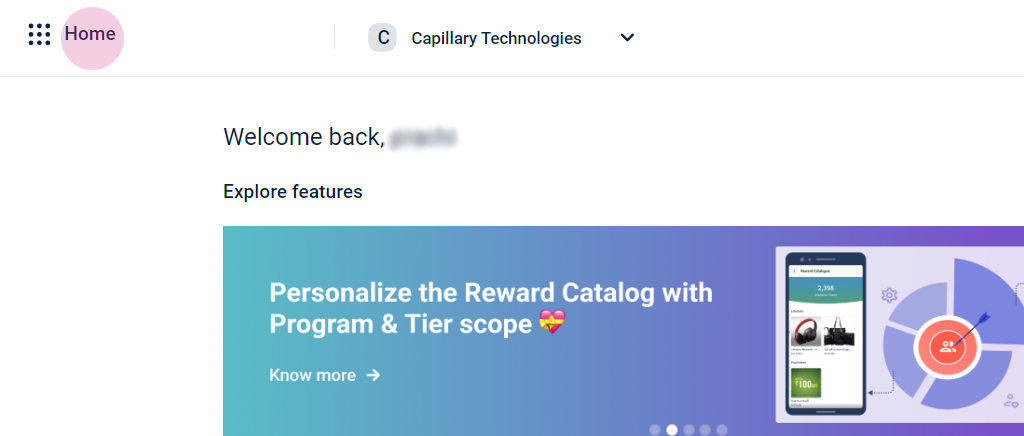

- Expand the dropdown menu and select the organization for which you want to see the report.


- Confirm the change.

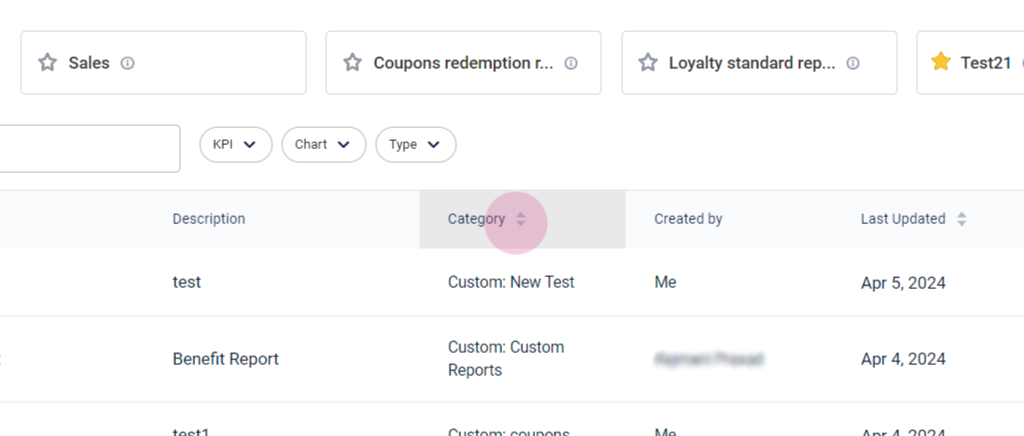
- The Insights+ home page, by default, shows all the reports. Type the name of the desired report in the search box.

- To filter the report list using a specific KPI, chart type or report type, expand the corresponding dropdown and select the desired category.


- Click the desired report from the Recently viewed report section. Up to four reports are displayed.
- To open any module-specific report, click and expand the module from the left navigation panel. For example, to see Loyalty+ reports, click on the dropdown menu and select the specific report. The desired report is displayed.


- To view reports created by you, click on Created by Me from the left navigation panel. All the reports that you have created are listed.

- To return to the full list of reports, click All Reports.

- Add a report to your favourites list by clicking Add to favourites.

- To view all your favourite reports, click the Favourites tab located in the left-hand navigation panel.
- To sort the report list based on Name, Category, or Last Updated date, click on the desired tab. The sorted list is displayed.


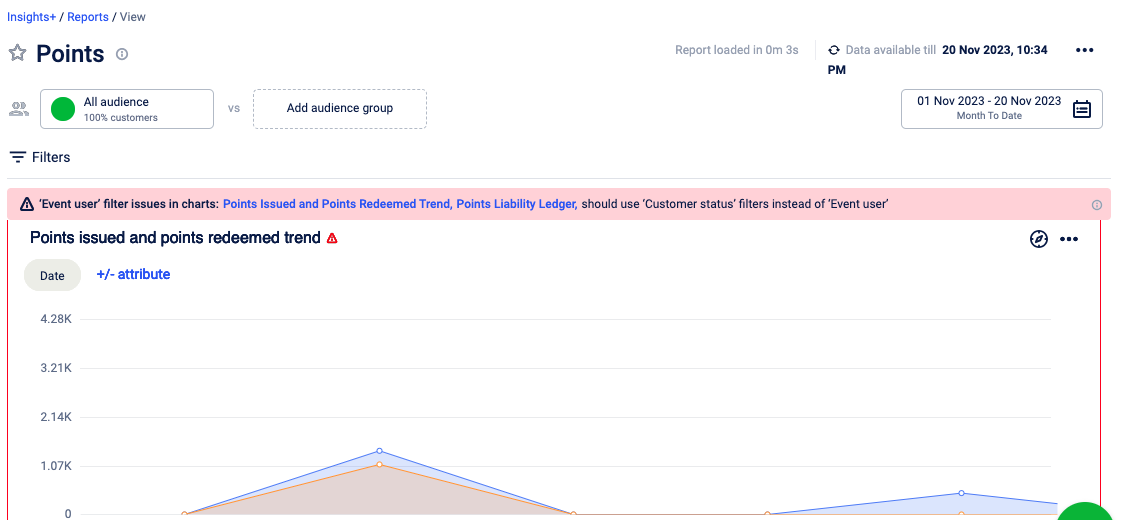
WARNINGA warning will appear if your org has selected 'Customer status' and 'Event user' filters while creating the chart. If customer status is enabled for your organisation while creating the chart:
- Make sure that you select all filters of Event Users and select the relevant filters under Customer status
- By default, customers with Deleted/ Internal/ Fraud confirmed are excluded from the report.
Using various display options to view the report
Upon opening the report, you can use the following data display options.
-
To view a KPI definition & Property, open the desired report. Hover over the information icon next to the KPI to see the KPI definition and property.

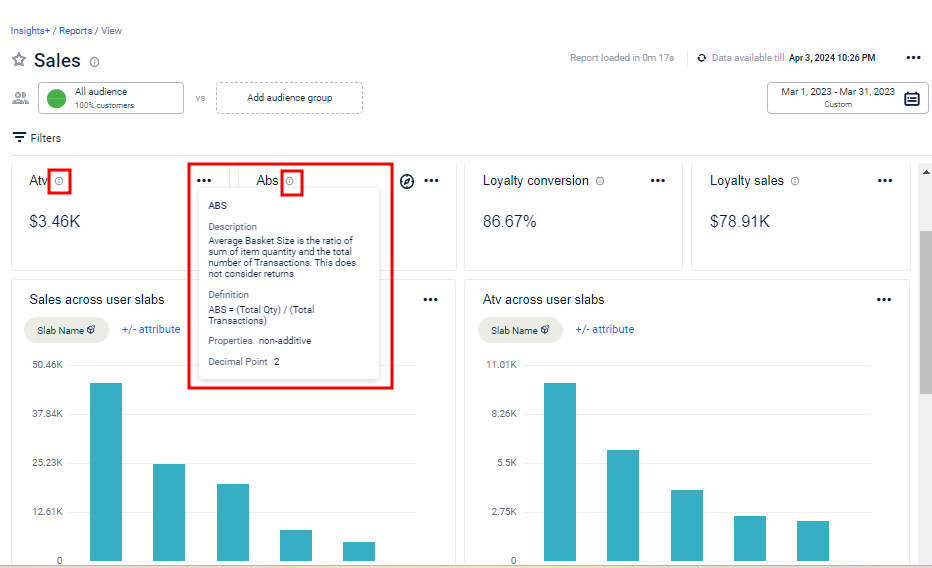
Alternatively, click More options > View chart details > KPI name to see the KPI definition and property.


- To see the data for a specific duration, click the Calendar icon. By default, the date filter shows the duration that was configured while creating the report. To know more about date filters, click here.

- To filter the report data, click Filters and select the desired dimensions/ attributes. Click Include to apply the filter.

- In order to add a dimension/ attribute to the chart card, click +/- attribute. Select the desired attribute and click Select. You can select up to 50 attributes.


- To view the chart based on percentage values, click the % icon.

- To view the Chart Explorer, click the Explore mode icon. This feature enables you to use filters, dimensions, KPI variables and visualizations. To know more about explore mode, click here.

- To view the chart details, click View chart details.


- To view the chart in Table or Pie chart format, click on the desired icon.


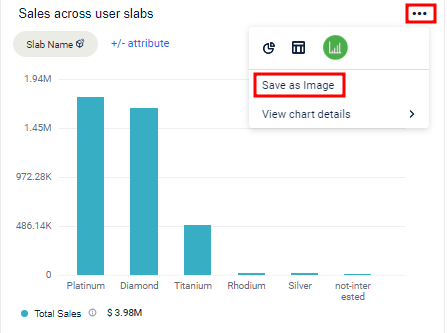
- To save the chart as an image file, click More options > Save as Image.
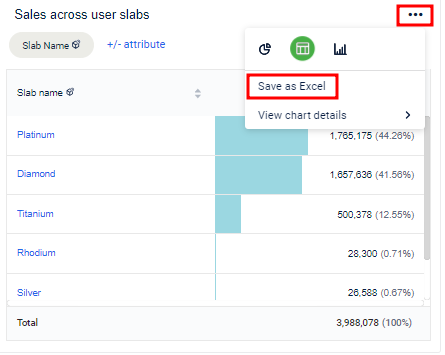
- To save the table as an excel file, click More options > Save as Excel.
Video
Updated 5 months ago
Did this page help you?