
Apply Dimensions to Charts
A dimension is an attribute by which you can classify and group the data. Dimensions can be applied to a KPI but cannot exist independently. Applying various dimensions to charts helps you understand business data, such as sales data categorized by date, zone, month, or year, enabling deeper insights and analysis.
When you select dimensions for a chart, cumulative totals rows are only displayed if all selected dimensions are from the Time hierarchy (such as Year, Quarter, or Month). If you include any non-time dimensions (for example, Customer Status or Acquisition Channel), the totals row will not appear in the report output.
For example, if you are interested in analyzing the number of transactions at each store, you can set "Transactions" as the Key Performance Indicator (KPI), representing the metric you want to measure. The dimension would be "Store-wise data," indicating that you want to categorize the transaction data based on different stores.
Similarly, in the second scenario, if you are examining sales data, you can set "Sales" as the KPI, representing the metric you are analyzing. The dimension would be "Product-wise data," indicating that you want to categorize the sales data based on different products.
There are two types of dimensions:
Primary Dimensions - These are the dimensions selected by default while creating the report.
Secondary Dimensions - These are the additional supported dimension attributes you can add to a chart.
You can apply dimensions for chart cards.
Add Dimensions/ Attributes to a Chart
When you add or change dimensions on a chart, keep in mind that cumulative totals rows are only shown if all selected dimensions are from the Time hierarchy. If you add any non-time dimensions, the totals row will not be available in the report.
You can replace primary dimensions with the same type of attribute values by expanding the drop-down box and selecting the values.
- To change the attribute of an applied dimension: Open the report and scroll down to the chart card for which you want to apply dimensions. Expand the attribute drop-down and select the required attribute.
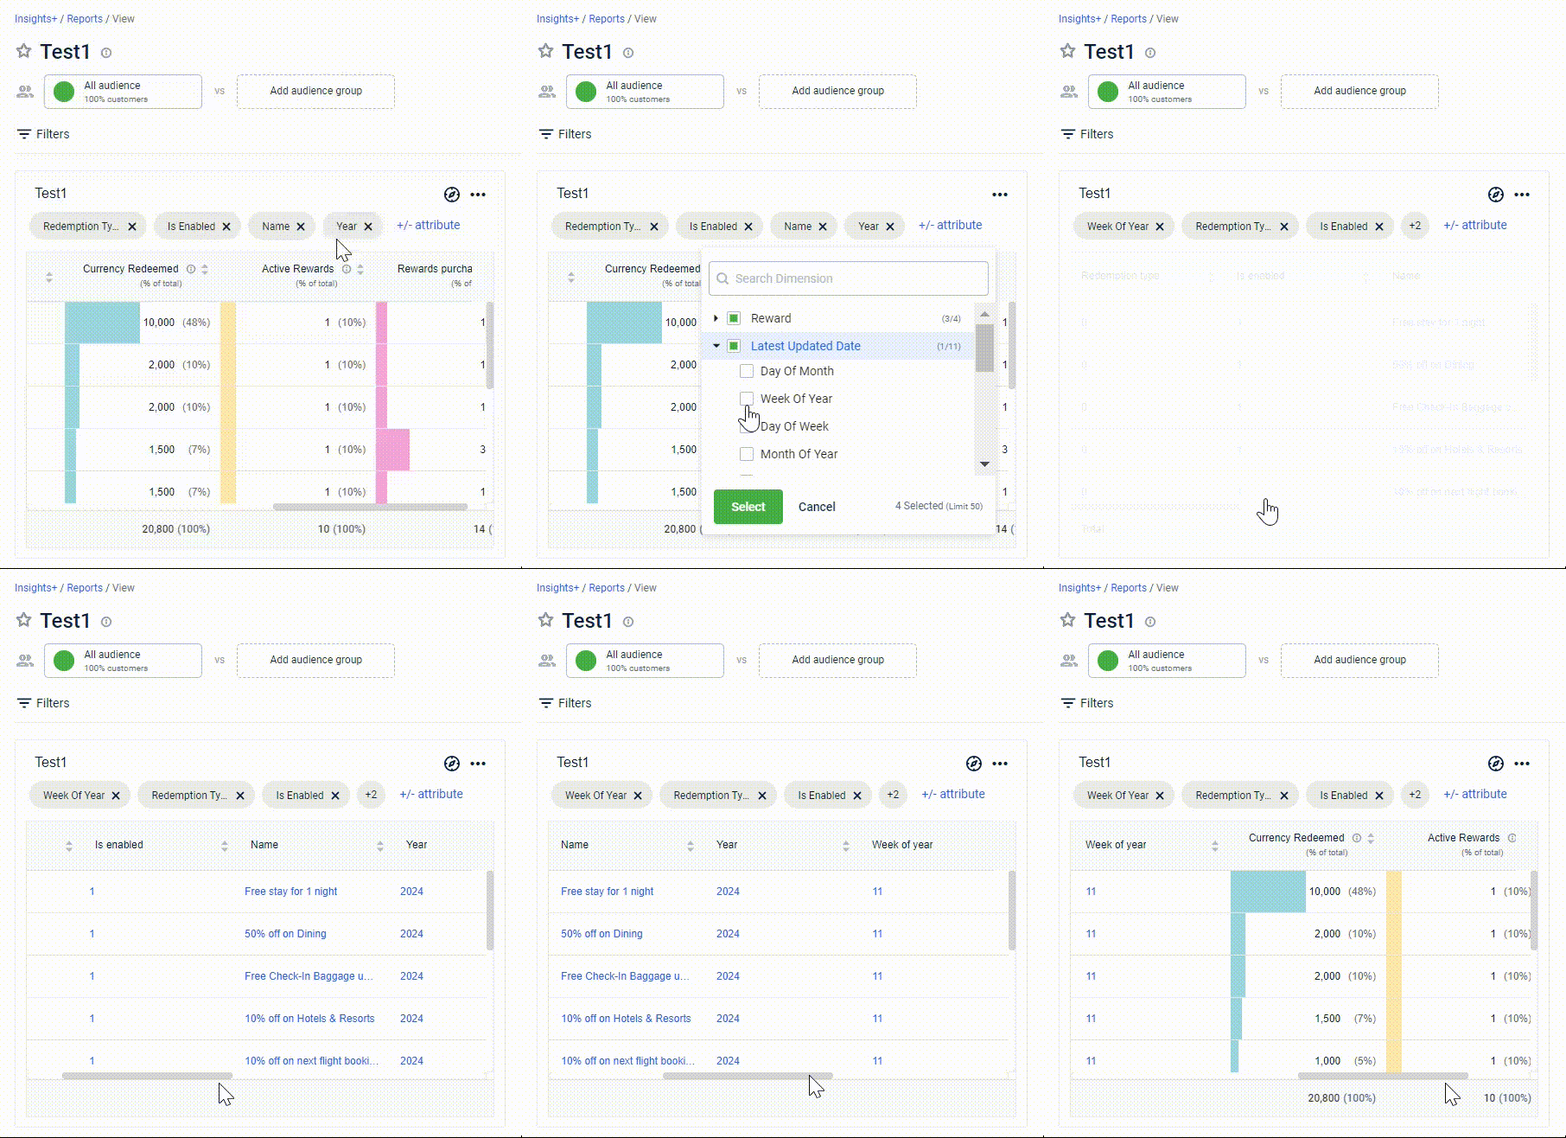
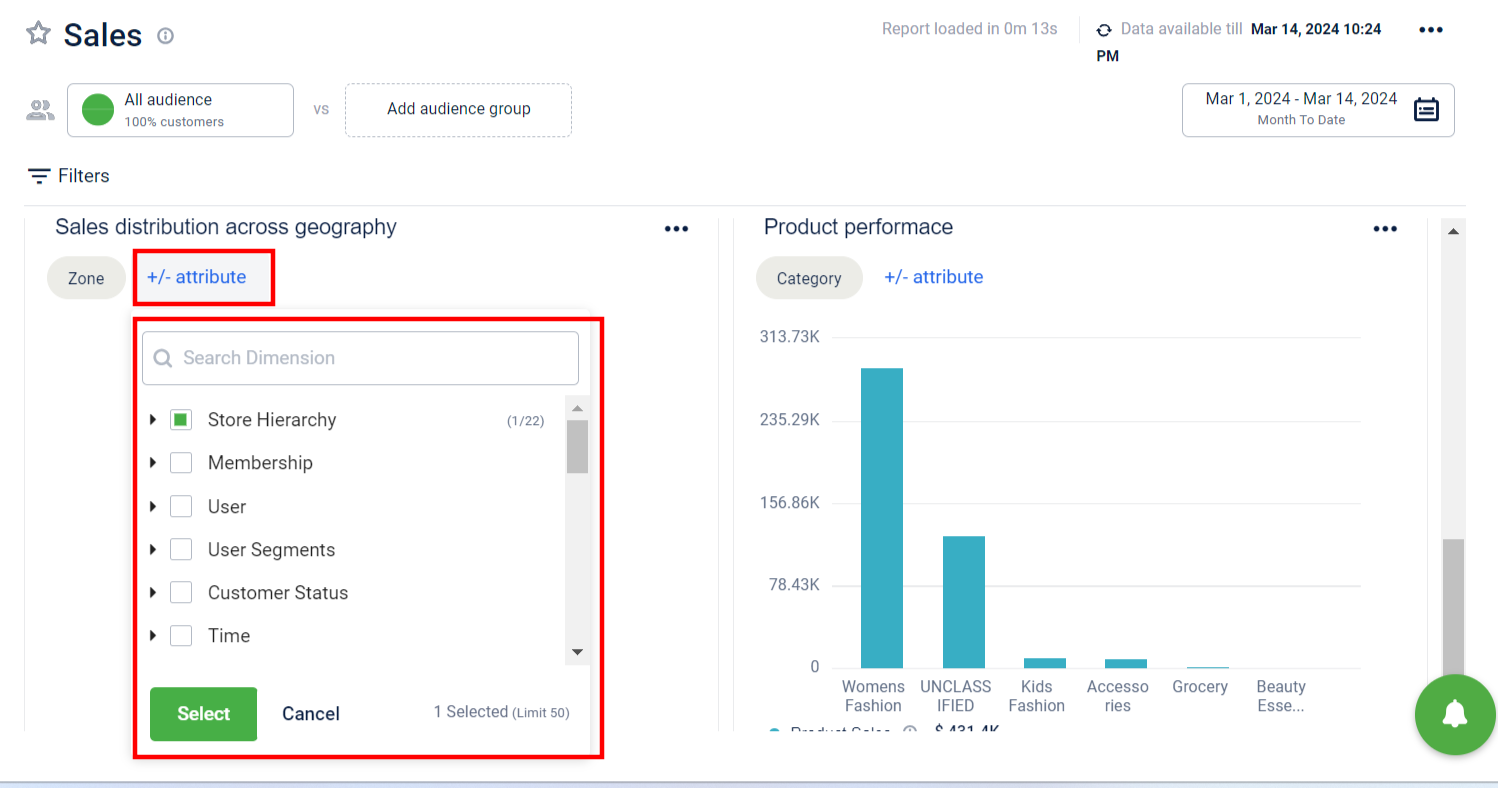
- To add more dimensions, Click +/- attribute.
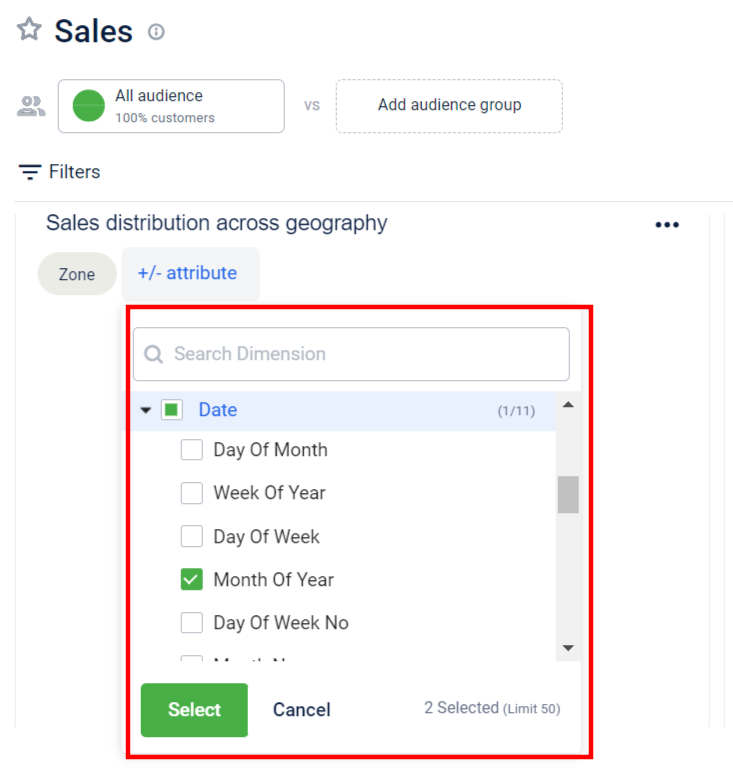
For example, to see a month-wise report of the current year, click Date to expand and select Month.
Following is the tabular format (for better understanding) of the zone-wise, month-wise reports.
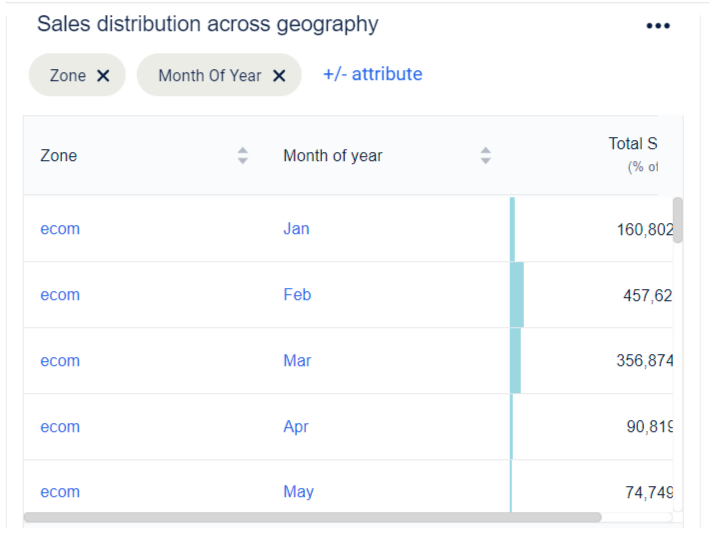
You can see all applied dimensions below the chart header.
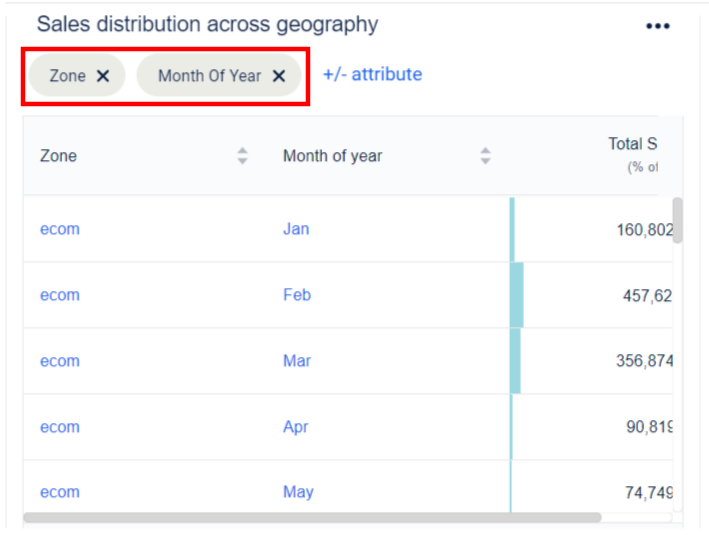
- Remove a dimension attribute: Click X to remove the respective attribute.
Note: Dimensions are applied at the chart-card level and cannot be applied to the entire report.
Updated 2 months ago