
Points
This report gives data on different points scenarios. This report provides a high level view of the points issual and redemption trend, value from extra sales and the overall points liability.
Use this report for points liability reportingThis report provides the standard Points liability ledger chart and it is the recommended method to checking your overall liability from points in the system
Points liability ledger
The goal of this chart is to give a complete view of the points liability in the loyalty program.
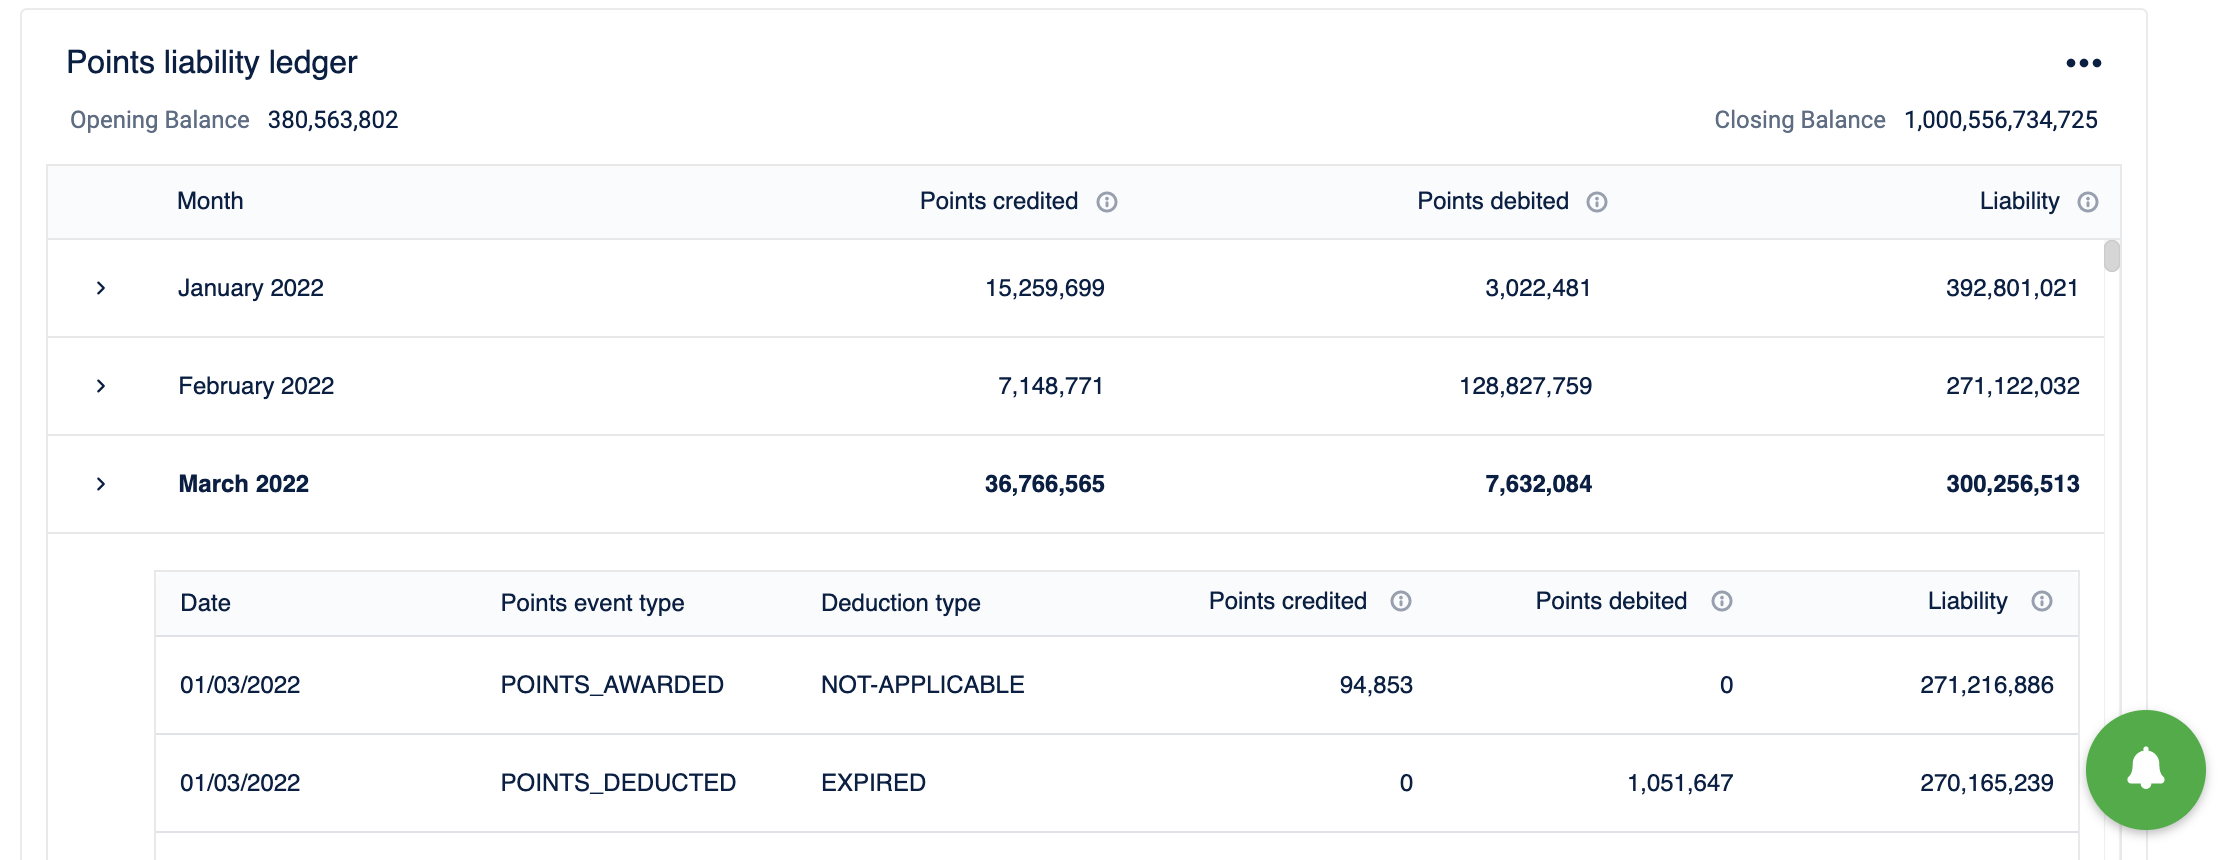
- By default, the points liability ledger chart shows the opening and closing balances, points credited, points debited and liability for the report's time period
- The opening balance is calculated as on the EOD of the previous date before the date range selected in the report. For example, if you want to check the chart or report for 1st April to 30th April 2022, the opening balance would be calculated as Points Credit ITD - Points Debit ITD as on EOD 31st March 2022
- The closing balance is calculated as on the EOD of the end date of the date range selected in the report. For example, if you want to check the chart or report for 1st April to 30th April 2022, the closing balance would be calculated as Opening Balance + Points Credit - Points Debit as on EOD 30th April 2022
Inclusions in points liability ledger
- The report and the charts only include redeemable/regular points. Promised points are not included in these charts
- The liability ledger chart by default includes all stores (including admin) and all customers (including fraud) - these are excluded by default in most charts. We have chosen to include them by default since they give a complete picture of the liability
- You can exclude or account for them by creating custom charts using these KPIs
- Points credited is the sum of all issued and adjusted points (Points adjustments are made typically to handle returns and include redemptions reverted, redemptions reversed, transfers reverted and expiries reverted)
- Points debited is the sum of all redeemed, expired and returned pointsOD + Opening Balance for the date range.
- Liability itself is used as ITD KPI in this chart, even if the chart and report are set for different timeframes. Liability represents the outstanding points balance as on a given date
- The chart uses month as the dimension and you can expand each month to see the breakup of the different types of debits and adjustments at a date level
Points event type for adjustment entries may also display as POINTS_DEDUCTED because of how they are stored in the database, they however represent credit entries and you will see values against them in the points credited column
Using the Liability KPI to create custom charts
- If you rather want to use this chart by considering exclusions, for example, if you want to view the data after excluding fraud customers, you can create a customer chart by using the Liability KPI and then changing the advanced settings as required
- You can use stores, time frames, etc. as dimensions, but when you create custom charts for a particular time period, keep in mind that you should be using the ITD charts only, otherwise the liability data obtained would not be correct. If charts are not ITD, liability data obtained would be only for the specified date range, and that would not be the correct method to look at liability
The report contains the following charts
| Chart | KPI/Chart | Description |
|---|---|---|
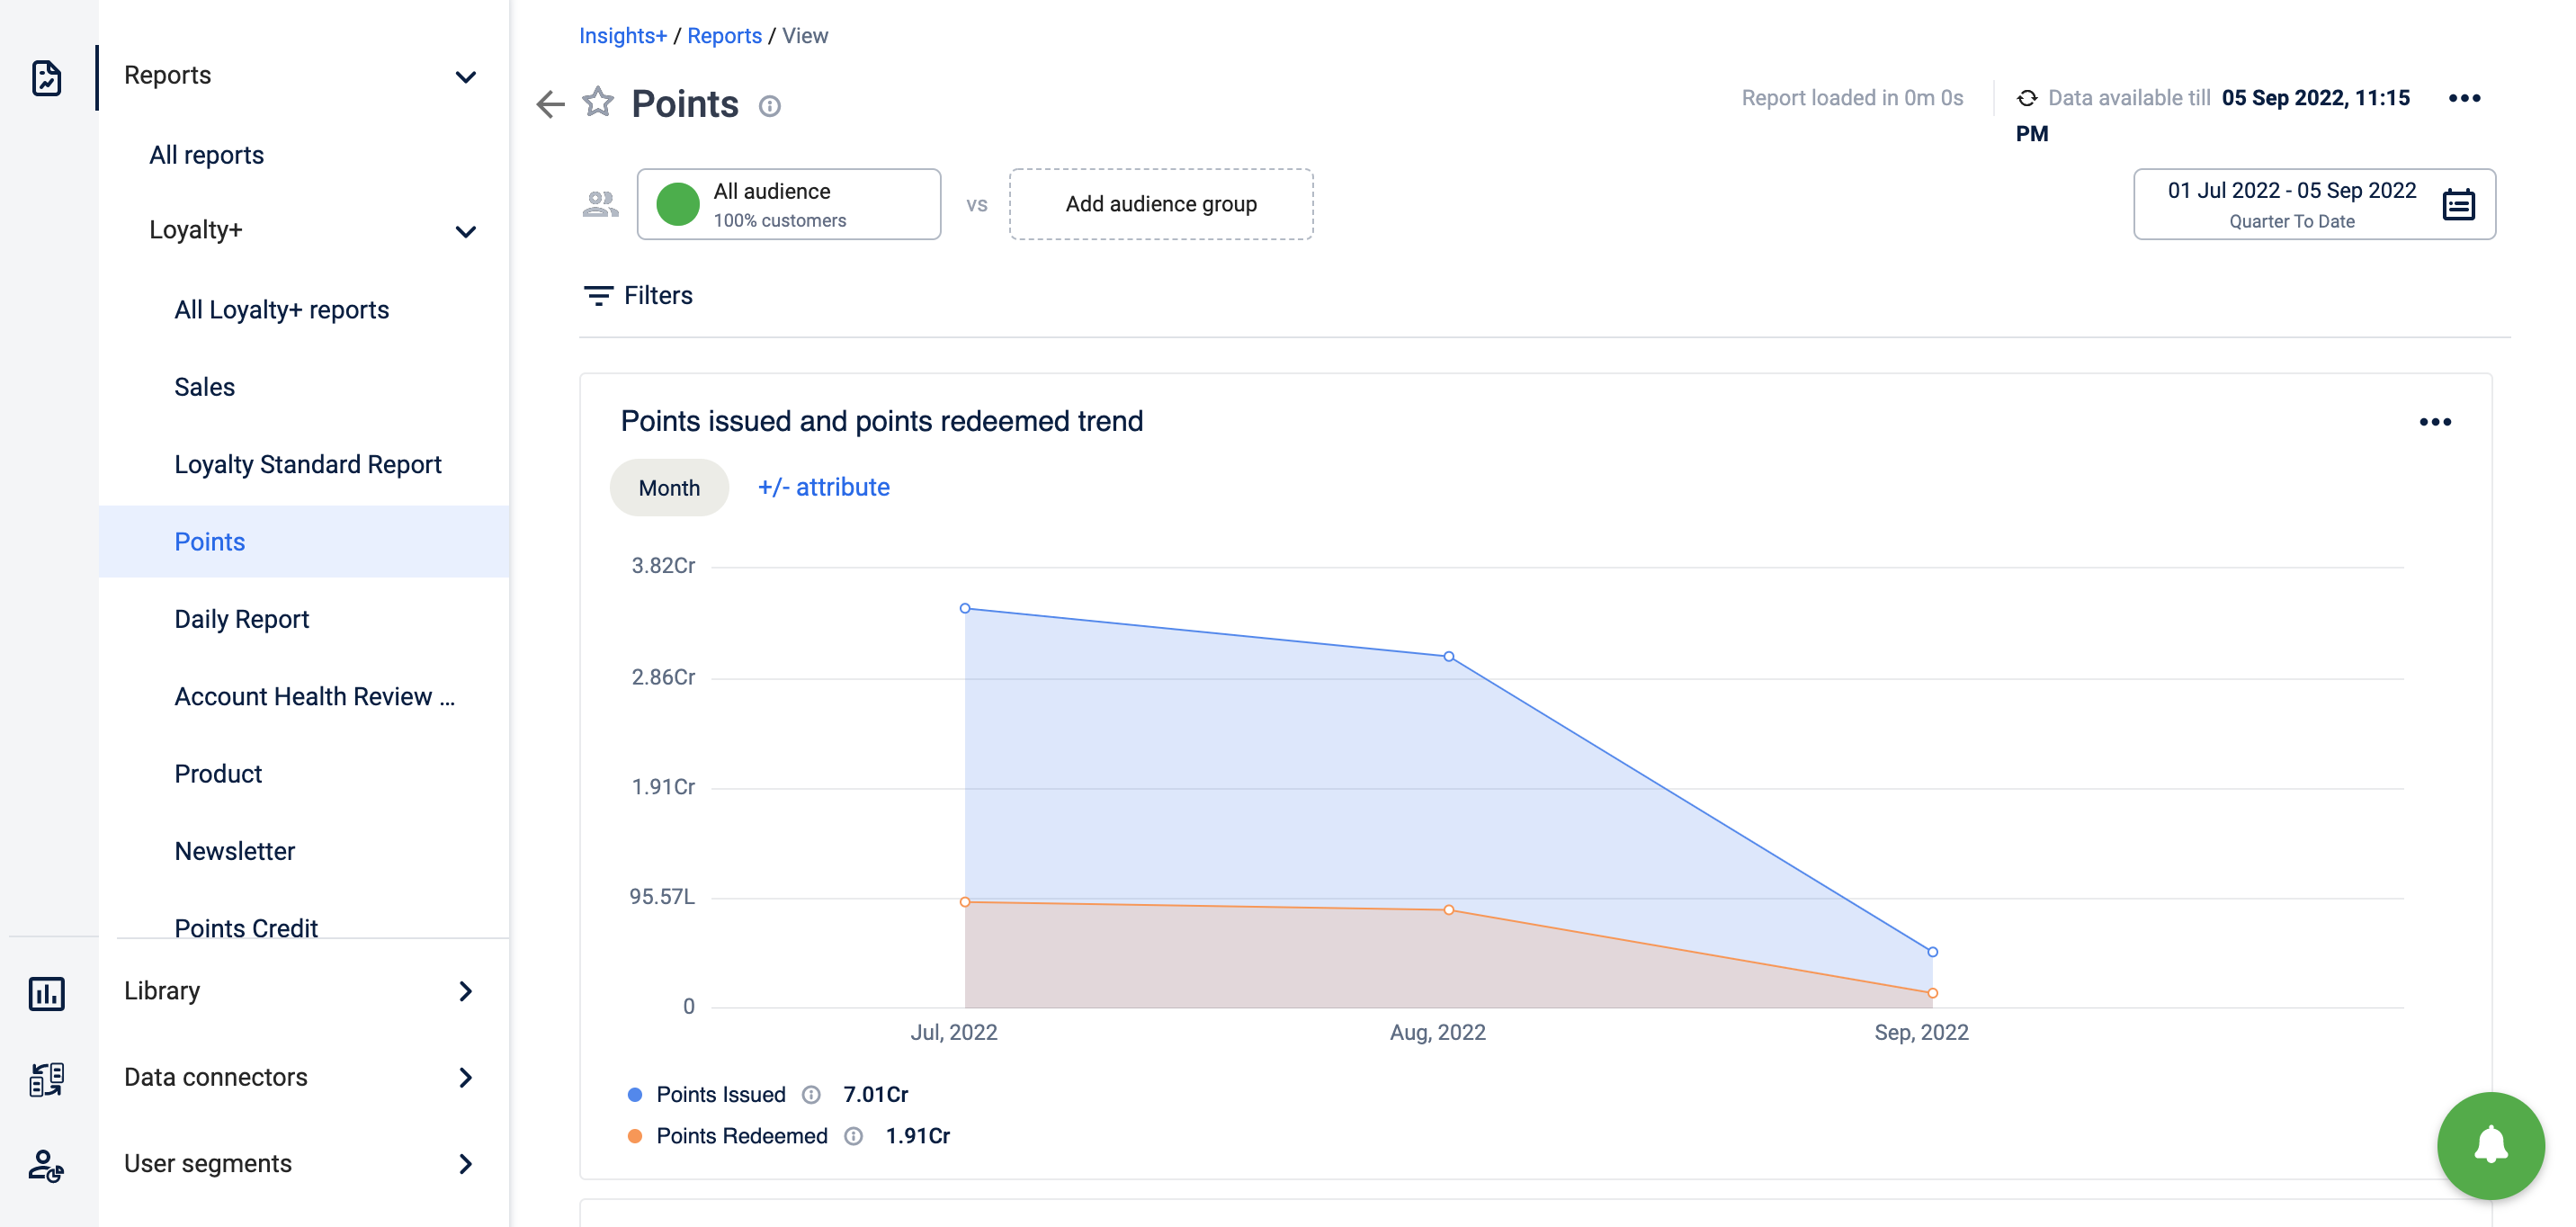
| Points issued and points redeemed trend | Chart | Points Issued (The total number of points issued to loyalty customers) and Points Redeemed (The total number of points redeemed by the Loyalty customers) plotted with Date as dimension |
| Sales vs extra sales across geography | Chart | Total sales and the Extra Sales (Sales from transactions against which some points have been redeemed) plotted with Store as dimension |
| Points liability ledger | Chart | This is a special ledger chart which shows the opening balance (points balance as on the beginning of the report start date) and closing balance (points balance as on the end of the report end date) |
Points can be issued for referral campaigns. Refer to the documentation for more information.
Updated 5 months ago