
View Campaign Reports
Campaigns overall performance report
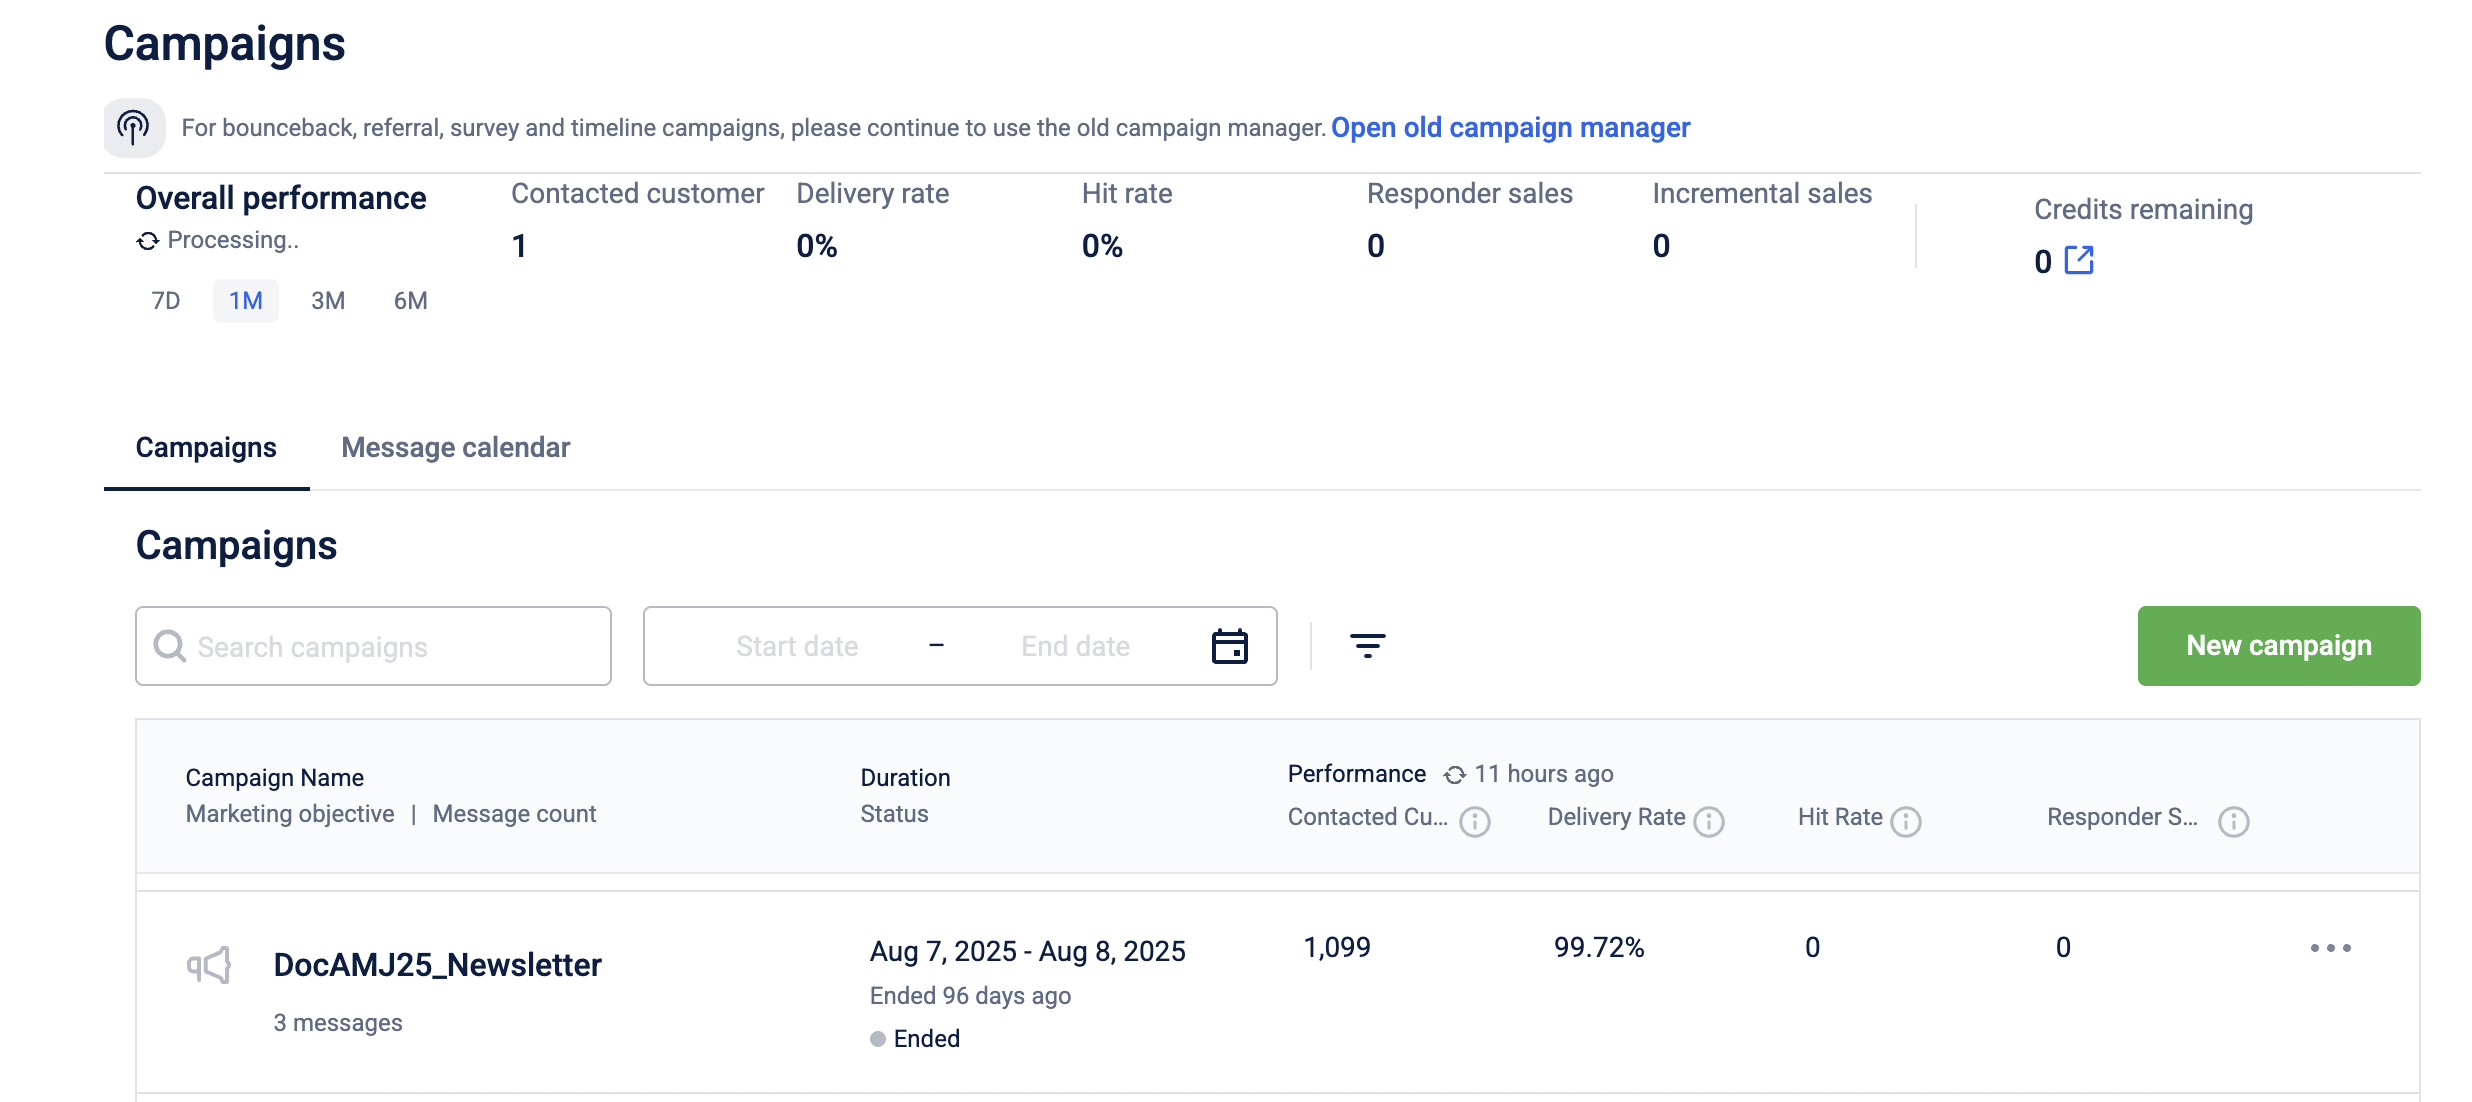
The Engage+ home page shows the overall performance of campaigns in the past 7 Days (7D), 1 month (1M), 3 months (3M), and 6 months (6M).
To see the campaign's overall performance:
- Log on to InTouch and navigate to the Engage+ (menu options).
- In Overall performance, click the period (7D, 1M, 3M, or 6M) for which you want to see the performance.
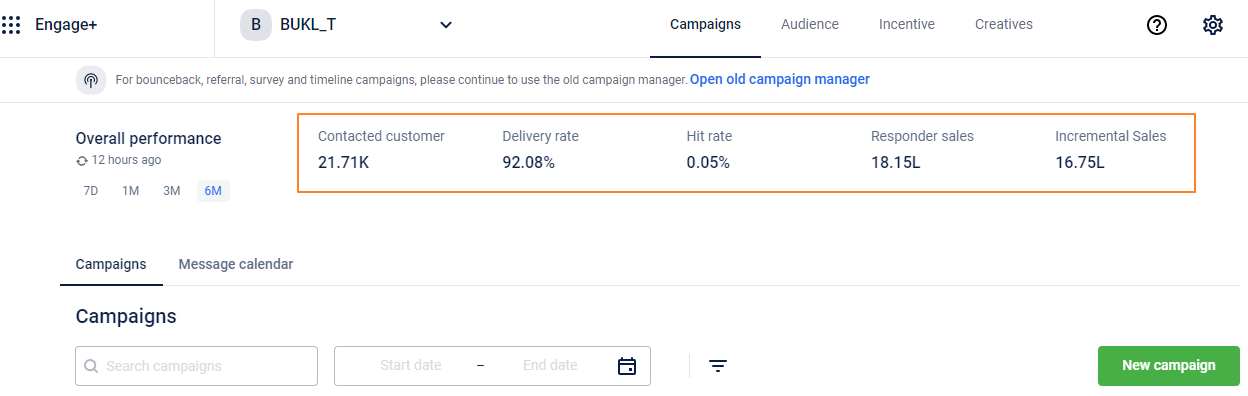
- Contacted Customer: The total number of customers to whom a communication has been sent out through campaigns for the selected period.
- Delivery Rate: The percentage of sent messages that have been delivered (received by the customers) successfully.
- Hit Rate: The percentage of customers to whom the communication has been sent out and who have transacted during the campaign duration.
- Responder Sales The total sales revenue generated by customers who completed the conversion goal (for example, made a purchase) after being contacted by the campaign.
- Incremental Sales:
Incremental Sales = (Test Hit Rate - Control Hit Rate) Test Contacted (Total Sales from Responders/Test Responders)
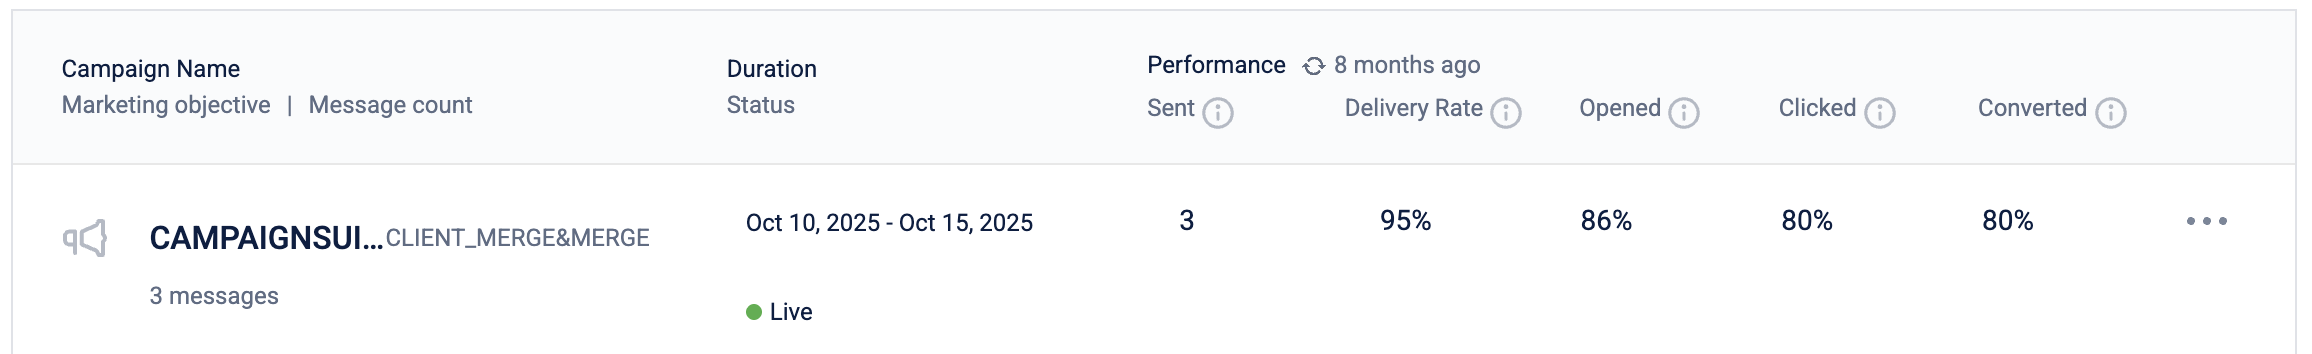
You can also view details of a specific campaign under the campaign listing section. This includes the following information:
| Field | Description |
|---|---|
| Campaign name | The name of the campaign. This also lists the number of messages and the status of messages in the campaign. |
| Duration | The duration of the campaign. This also lists the current status of the campaign |
| Sent | The total number of messages sent as part of the campaign. |
| Delivery rate | The percentage of users who have successfully received the communication. |
| Opened | The percentage of users who have opened the communication received. |
| Clicked | The percentage of users who have clicked on an included link. |
| Converted | The percentage of customers who have completed the conversion goal. |
On the basis of test and control group campaigns, incremental sales are categorized as follows.
- Incremental Sales - Campaigns with Test and Control: The formula is as mentioned above. However, only campaigns that have a control group are considered in this computation. If a campaign does not have a control group (or if incremental sales are negative), the value for this KPI will be 0.
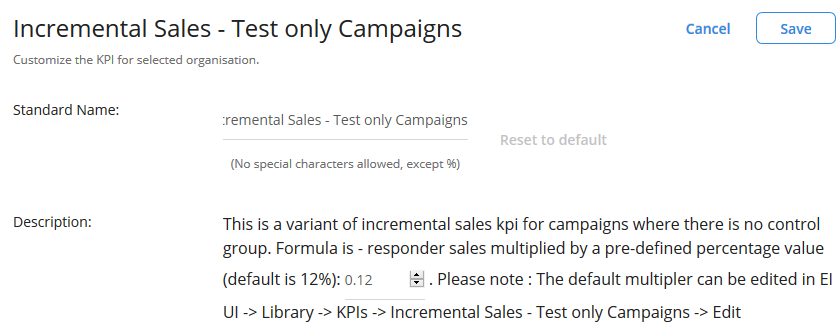
- Incremental Sales - Test only Campaigns - In campaigns where there is no Control group, a percentage of responder sales will be considered as incremental sales. This percentage value is currently 12% by default. However, you can modify the percentage value in Insights+ (Library -> KPIs -> Incremental Sales - Test only Campaigns -> Edit).
- If a campaign has a Control group, the value for this KPI will be 0.
- Incremental Sales - Variant - This KPI will give a sum of (1) and (2) mentioned above. You should use this directly for reporting incremental sales. However, you need to change the percentage of responder sales value (explained in (2) above) separately for this KPI. You can also change the name of the KPI for your org.
View campaign summary report
To view the summary report of a campaign, follow these steps.
-
On the Engage+ home page, scroll down to the Campaign tab.
-
Search and select the campaign for which you want to see the report.
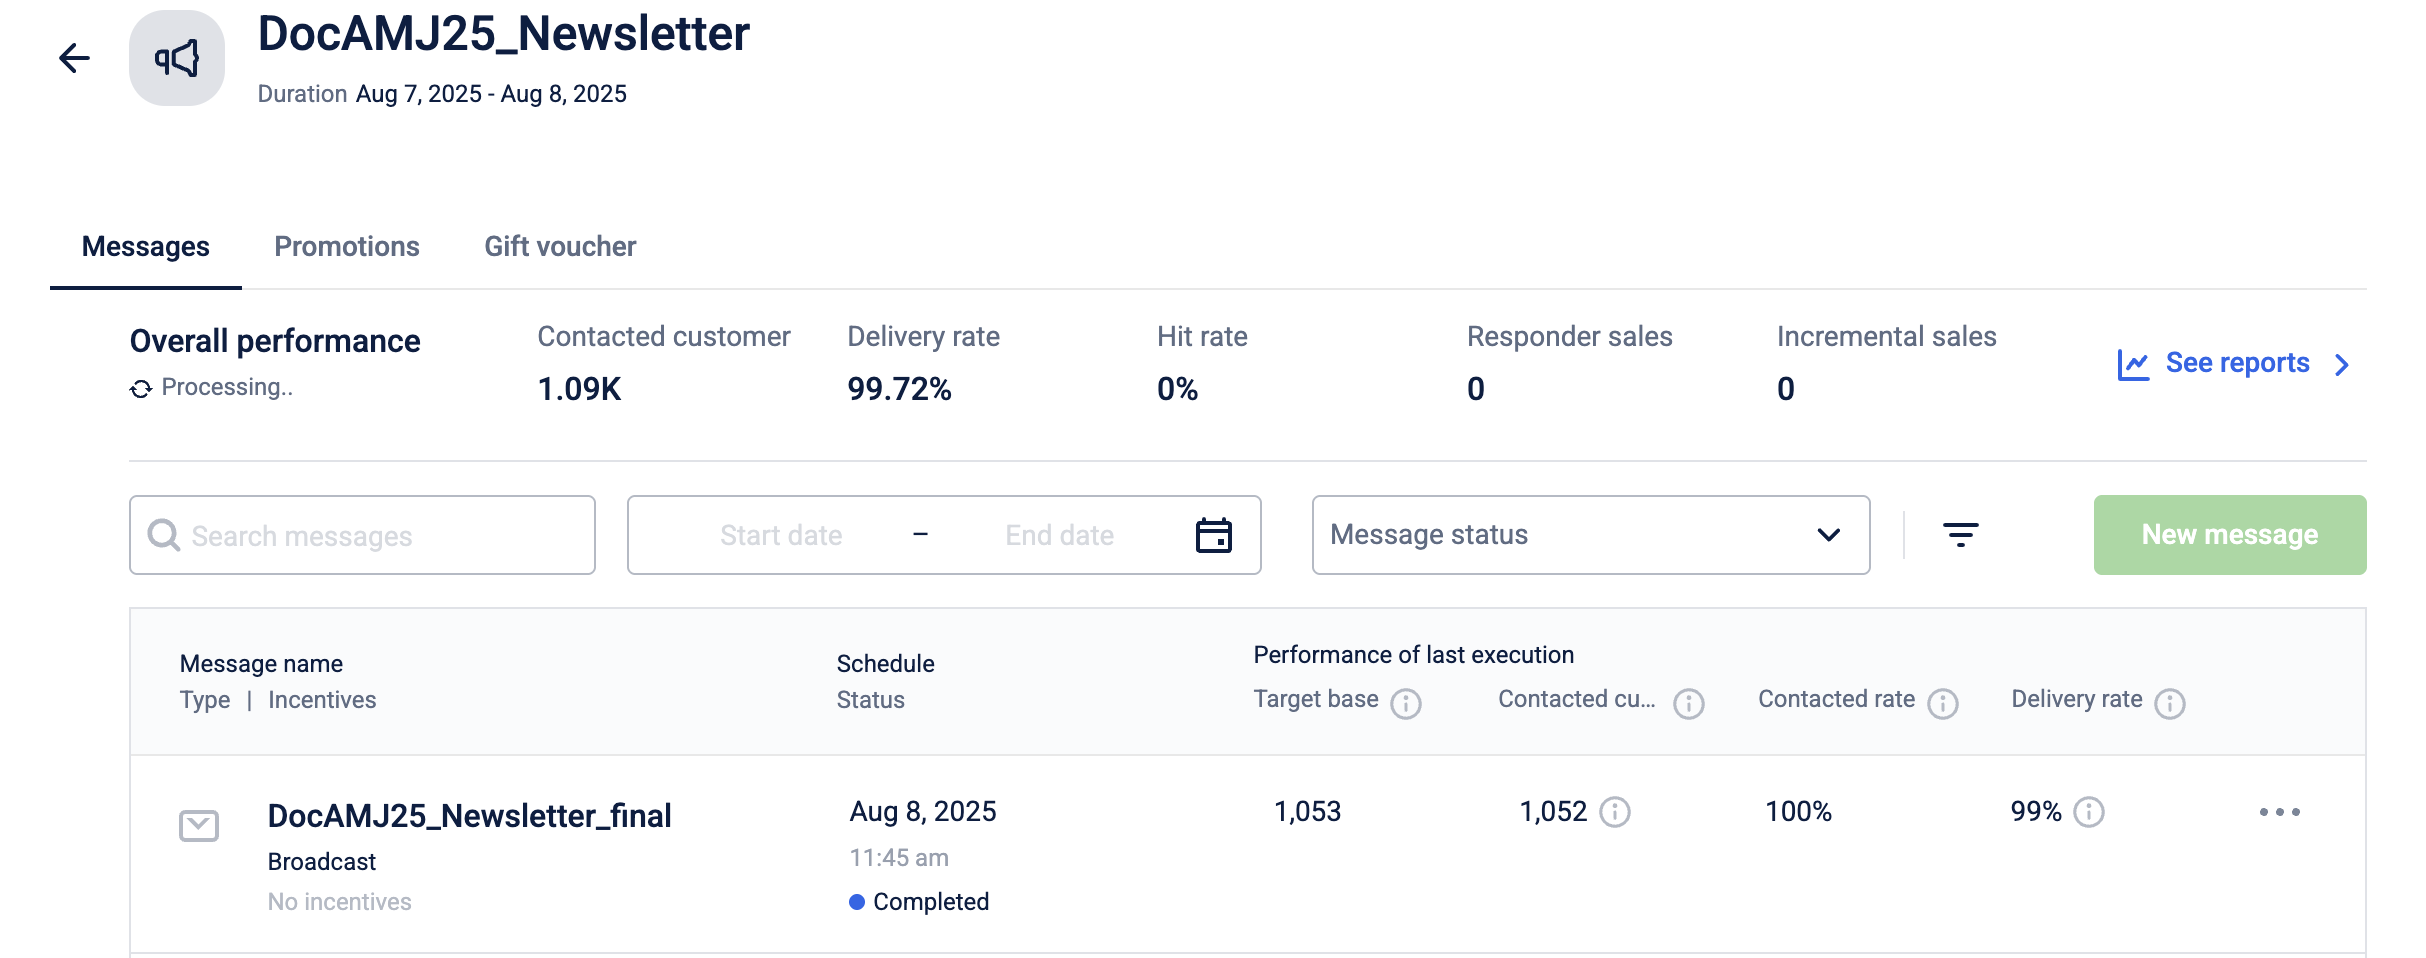
-
Real-time open and click rates.
(Open): The number of customers who have opened the email
(Clicked): The number of unique customers that clicked on the link sent through email. -
Scheduled Status: The current status of the scheduled campaign. Upcoming, Live, Ended, Completed.
-
Performance Target Base: The total number of targeted customers for the campaign message.
-
Contacted customers: The total number of customers reached through the campaign.
-
Contacted rate: The percentage ratio of the contacted customers to the targeted customers.
-
Delivery rate: The percentage ratio of messages sent minus messages bounced to the total number of messages sent.
-
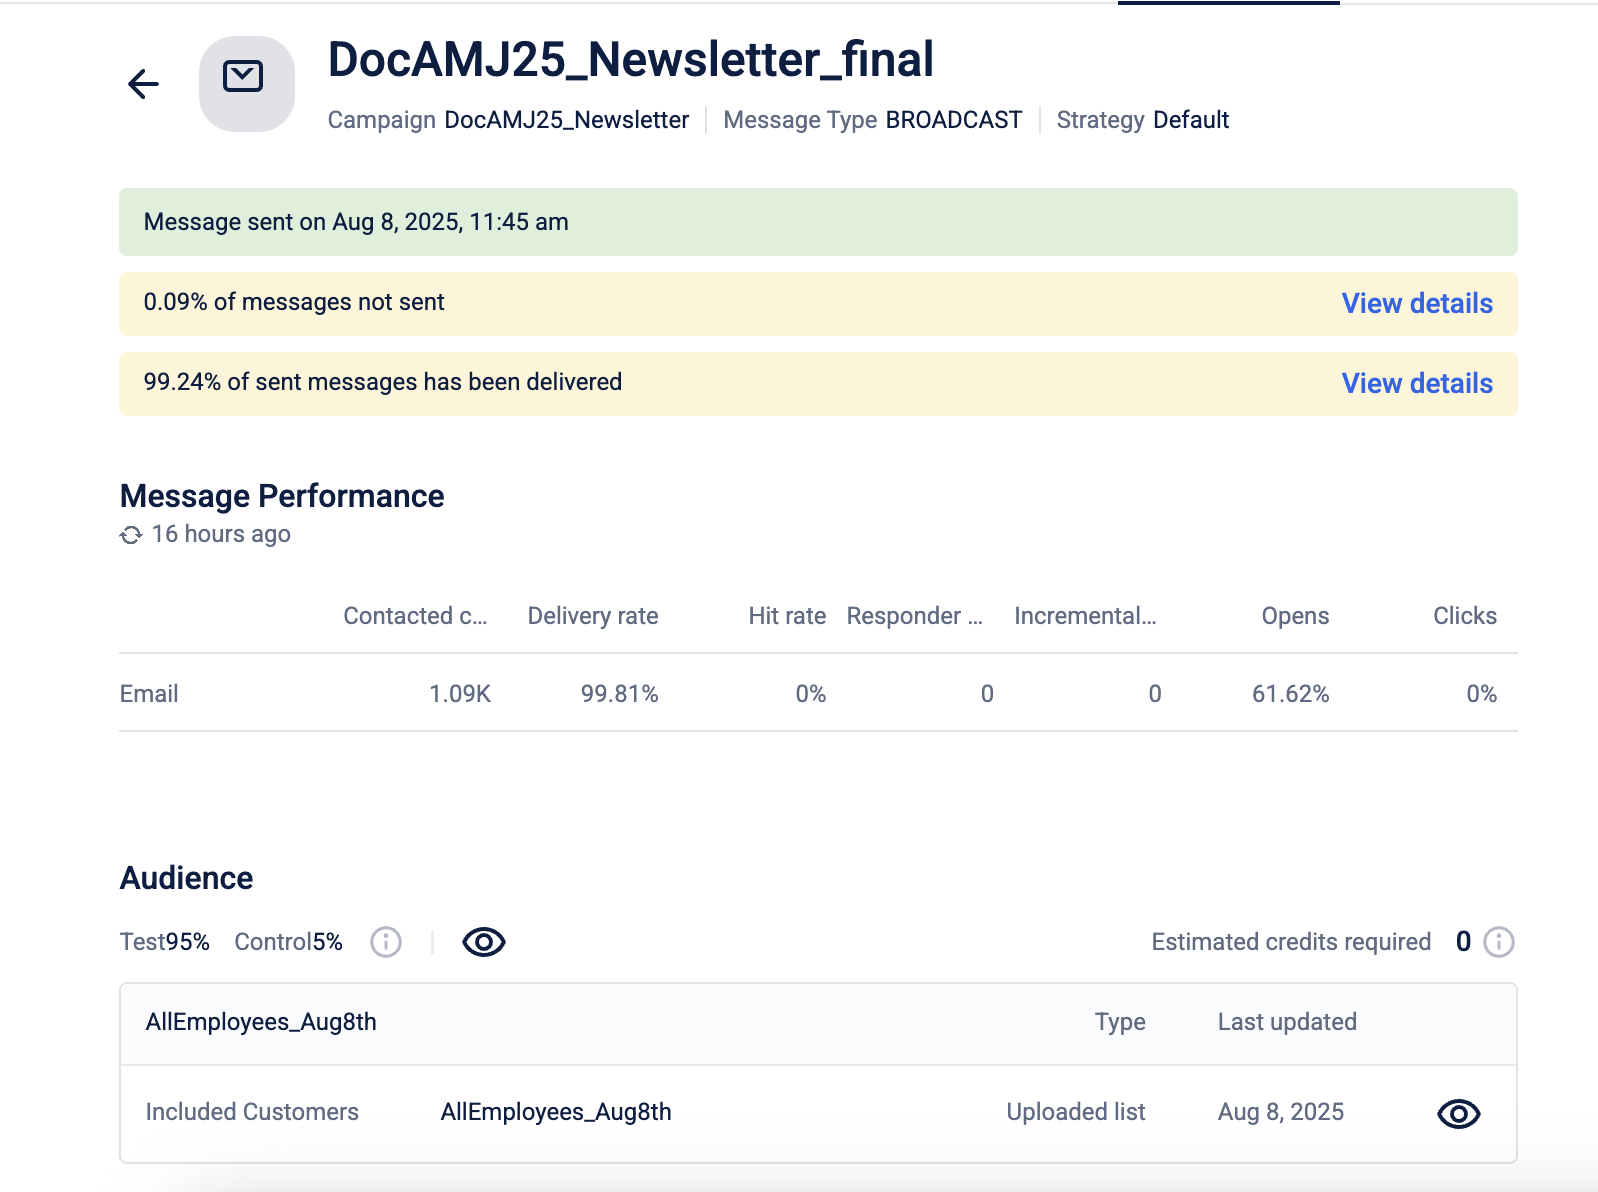
Open the Message to view the detailed performance report.
Note: Currently, the Performance page in campaign analytics displays overall performance data for push notifications without differentiating between sub-channels such as Android or iOS. All push notification metrics—including delivery rate, contacted customers, and hit rate are aggregated across platforms. Platform-specific insights (e.g., Android vs. iOS delivery rates) are not available in the current reporting interface.
Report notification and failure alert settings
You can set notifications of daily campaign summary reports, weekly SMS and email credit report, and campaign execution update.
Report Notifications
To notify users on the campaign level report, do the following.
- On the Engage+ home page, click on the setting icon, and navigate to the Reports page.
| OPTION | DESCRIPTION |
|---|---|
| Daily campaign summary report | Enter the email IDs of users (comma separated values) that you want to send daily notifications on the Campaign Summary Report. |
| SMS Email credit report | Enter the email IDs of users (comma separated values) that you want to send the available SMS and email credits on a weekly basis. |
| Email notification on message execution status | Enter the email IDs of users (comma separated values) that you want to notify whenever a campaign message is executed with the execution status. |
View campaign and delivery Status in message calendar
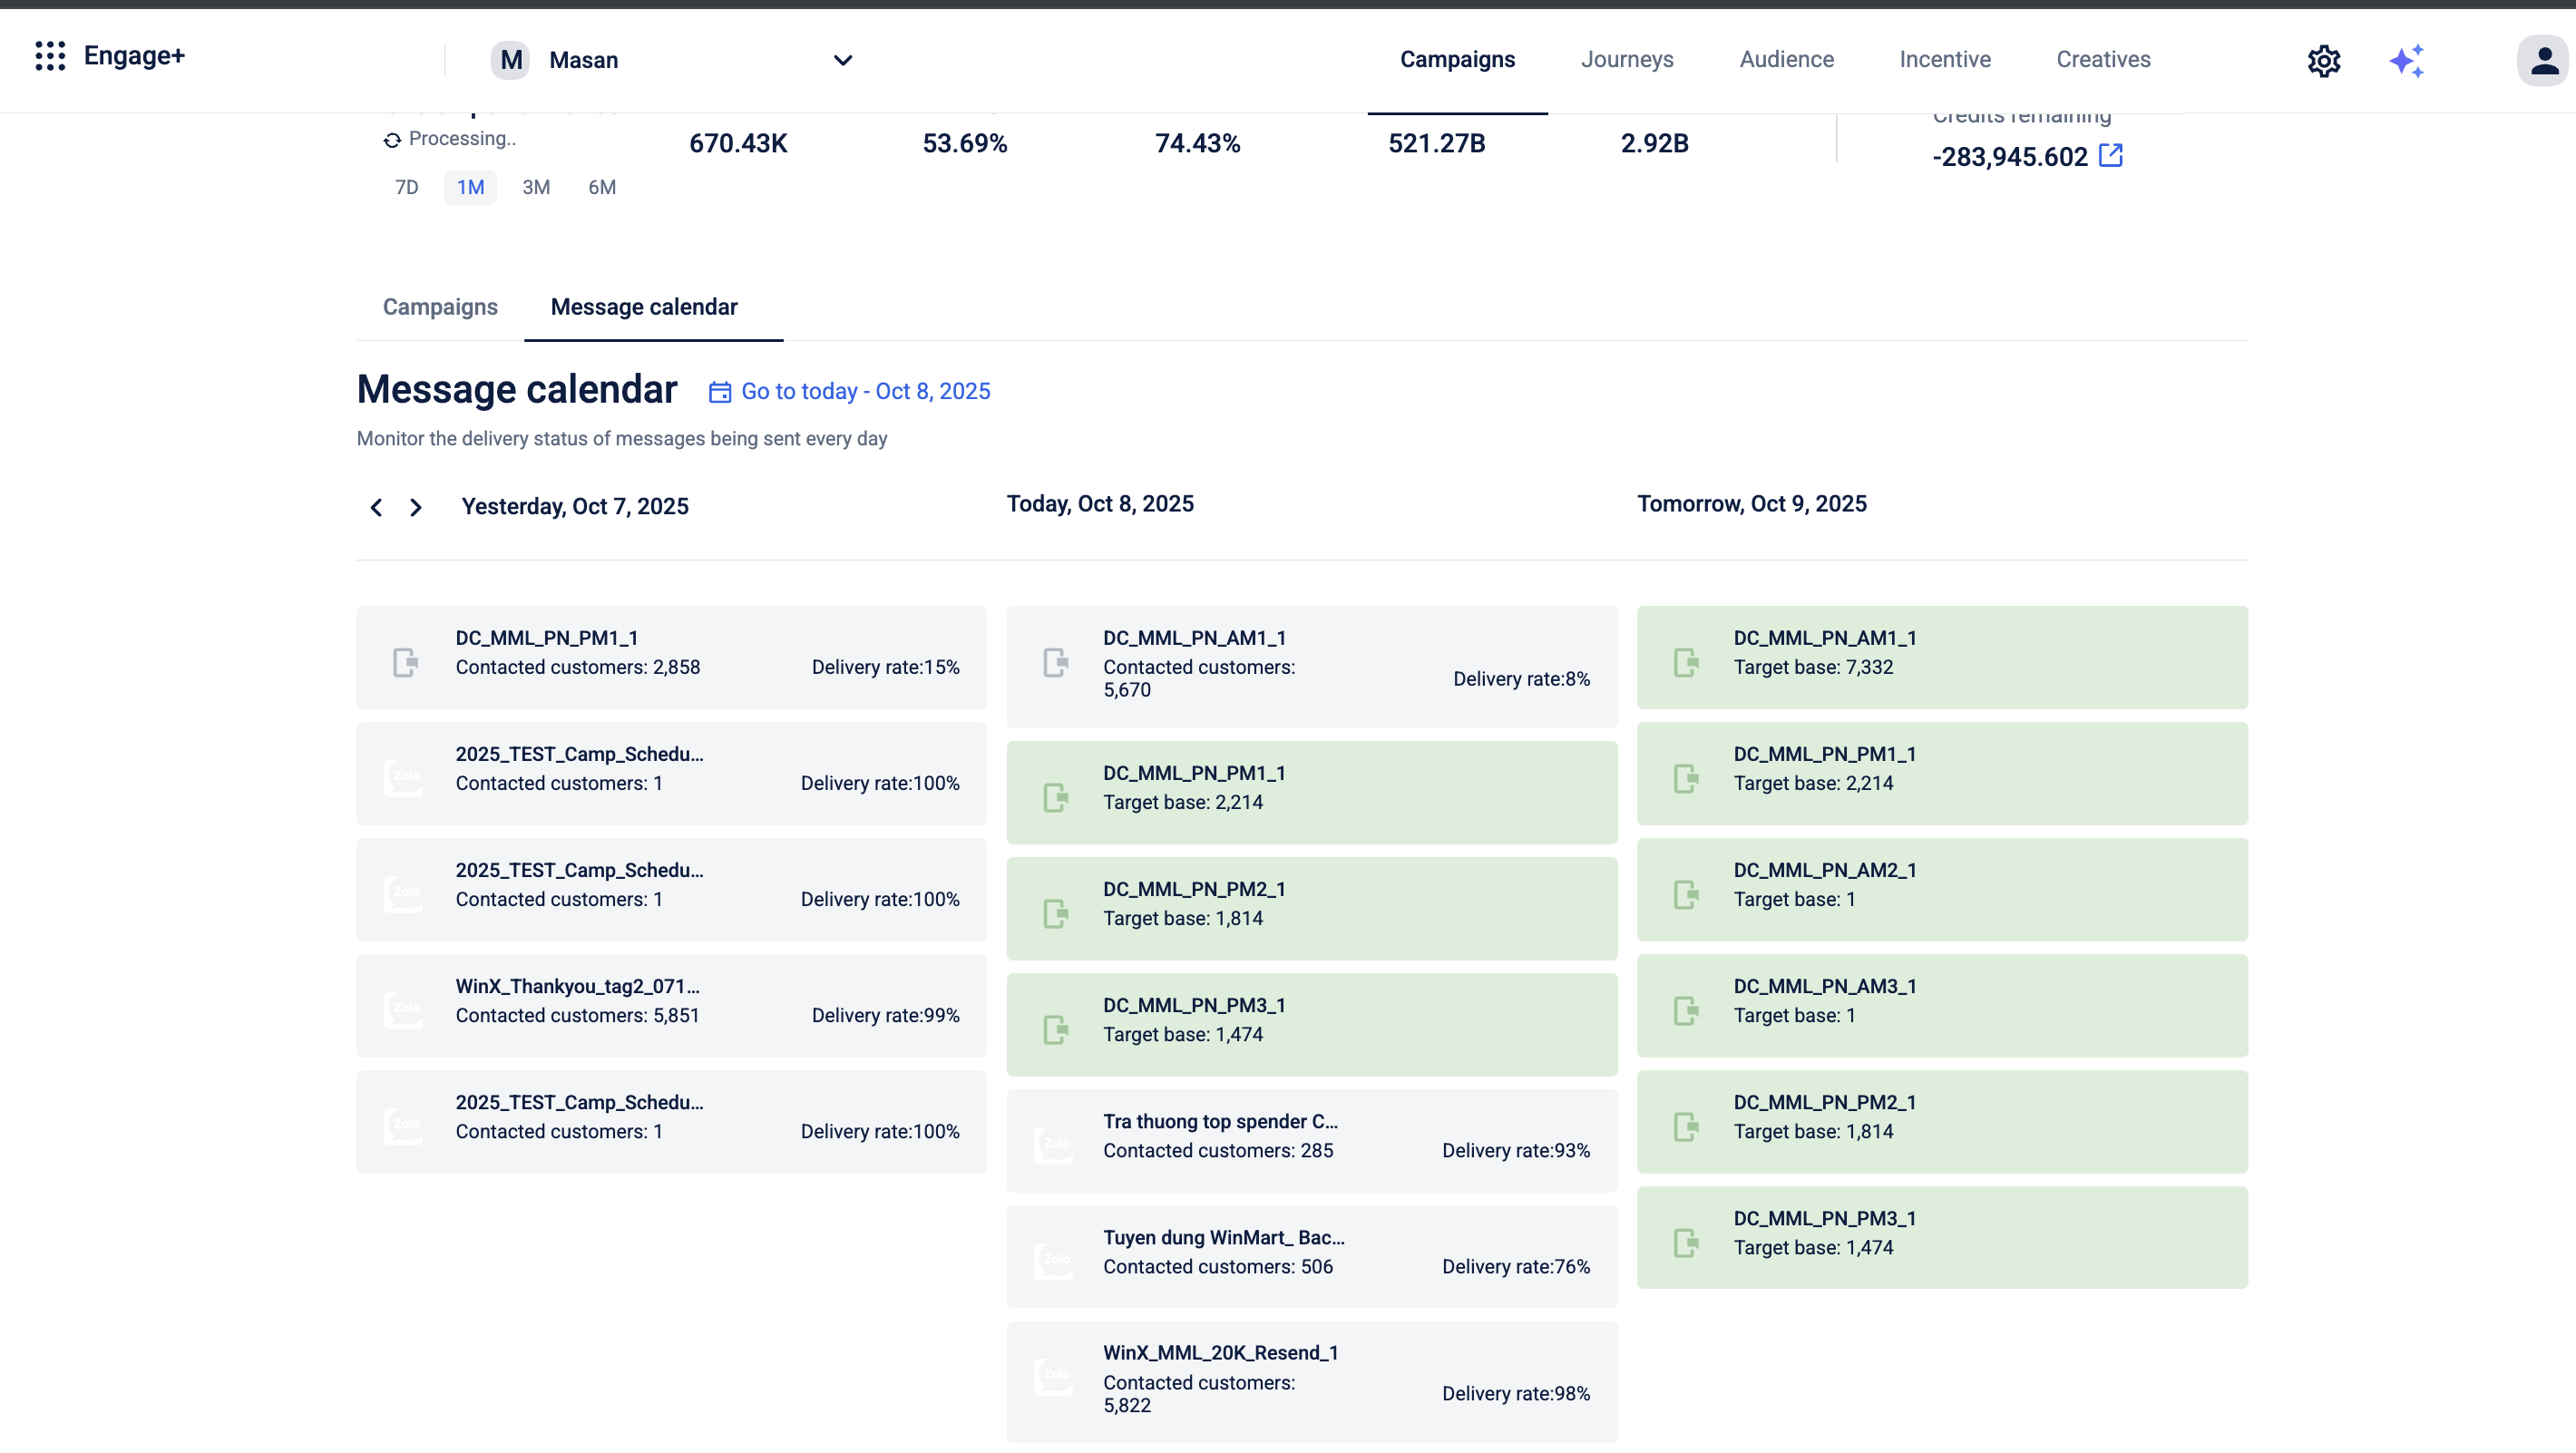
The Message Calendar allows you to view both the campaign status and delivery status for each campaign on a specific day.
For example, if you want to check how many campaigns were run on a particular day and view their approval and delivery progress, you can use the Message Calendar to see the status of each campaign scheduled for that date.
To view campaign and delivery statuses follow the given steps:
- From the Campaigns listing page on the Engage+ homepage, select Message Calendar.
- The calendar displays campaigns with their respective statuses:
- Campaign Status: Indicates whether a campaign is approved (green) or waiting for approval (orange).
- Delivery Status: Shows the number of customers contacted and the delivery rate after the campaign has been sent.
- Use the arrow
<>icons to navigate and view campaign details for the previous or next three days. - To view details for the current three-day period, select the calendar icon.
Updated 5 months ago