
Monitoring and Observability in Connect+
How to view dataflow run status, performance metrics, block-wise breakdowns, error logs, and configure alerts in Connect+.
Once a dataflow is live, Connect+ gives you two layers of visibility into what is happening with your data. The first is built directly into the Connect+ UI. The second is the Developer Console, a separate observability tool that operates at the system level.
Together, these two layers let you monitor processing health at a glance, investigate errors at the file and record level, receive automated notifications when something goes wrong, and trace individual API requests through the platform.
What you can do
View dataflow-level performance
- See overall input counts, output counts, errors, warnings, and accuracy percentage from the Performance tab inside each dataflow.
- Filter data for up to 30 days.
- Use block-wise performance to see input, output, and error counts per block and pinpoint exactly where records are being lost.
Investigate errors
- View each distinct error message, the block it occurred in, and how many times it appeared from the error summary.
- Search and filter errors by block or date.
- Access error report files on FTP from the Error log tab. Each file covers one run and is available for 30 days, with per-record detail including the lineage ID assigned to each processed file.
Schedule summary reports
- Configure automatic email summaries of dataflow activity on an hourly, daily, or custom interval schedule.
- Each report includes the dataflow name, file name, ingestion time, total record count, success count, and failure count broken down by block.
Monitor at the system level via the Developer Console
- Track request throughput, latency at the 95th percentile, error rates by status code, and API-level drill-downs into Capillary core platform calls using Platform Metrics.
- Search for specific requests using App Request Logs.
- For Neo-based dataflows, open Neo Log Insights from a request to inspect the full execution of a single record, including raw logs, block execution flow, block input and output, and request details.
Configure alerts
- Set threshold-based alerts on metrics such as 4xx and 5xx error rates, latency, failure percentage, and retry exhaustion.
- Scope alerts to specific dataflows and marks them as warning or critical.
- Receive a notification with a custom message when a condition is breached.
Alerts
Connect+ sends email alerts when a dataflow encounters an issue. Each alert identifies the failing block, describes the issue, and links to the affected dataflow. Alerts fire as soon as the threshold configured in Alert Management is exceeded.
Connect+ monitors three signals across your dataflows:
- Throughput per minute
- Processing latency
- Error rate
Connect+ provides two types of alerts.
Default alerts
Connect+ configures default alerts automatically. They are triggered based on system-defined thresholds and are active for all applicable dataflows. No setup is required.
Manual alerts
Manual alerts, also called custom alerts, are alerts you configure. You set the threshold at which the alert triggers, giving you control over sensitivity based on your use case. You can set up these alerts in the Alert Management section of the Dev Console.
Alert scope
Each alert applies to one of two scopes.
| Scope | Description |
|---|---|
| Dataflow | The alert applies to a specific dataflow only. |
| Dataflow and organization | The alert applies at both the dataflow and the organization level. |
Alerts reference
| Alert name | Category | Type | Trigger | Condition and threshold | Scope |
|---|---|---|---|---|---|
| Partial Failure Alert | File and Stream | Manual | Run completes with partial failures exceeding threshold | 10% or more of records exhaust all retry attempts within a 10-minute window. | Dataflow and organization |
| File-Level Failure Alert | File | Manual | Run completes with failed records | Total failed records are 10% or more of execution | Dataflow and organization |
| Latency Alert | File and Stream | Manual | Processing latency exceeds threshold | Processing time exceeds the threshold you set | Dataflow and organization |
| 5XX / Failure Alert | File | Default | 5XX errors and processing failures detected | 1% or more of records fail within 10 minutes | Dataflow and organization |
| Dataflow Validation Alert | File and Stream | Default | Scheduled validation check after dataflow creation | Validation check runs automatically 15 minutes after the dataflow is created | Dataflow |
| No File Picked Alert | File | Default | No file received within expected time window | No file arrives within the time window you define | Dataflow and organization |
Alert descriptions
The alerts below describe the conditions that trigger each notification and the thresholds at which they fire.
5XX failure alert
This alert monitors file-based dataflows for server-side API errors and processing failures. It fires when failed records, including those caused by 5XX API errors, reach 1% or more within 10 minutes. The alert applies at both the dataflow and organization level.
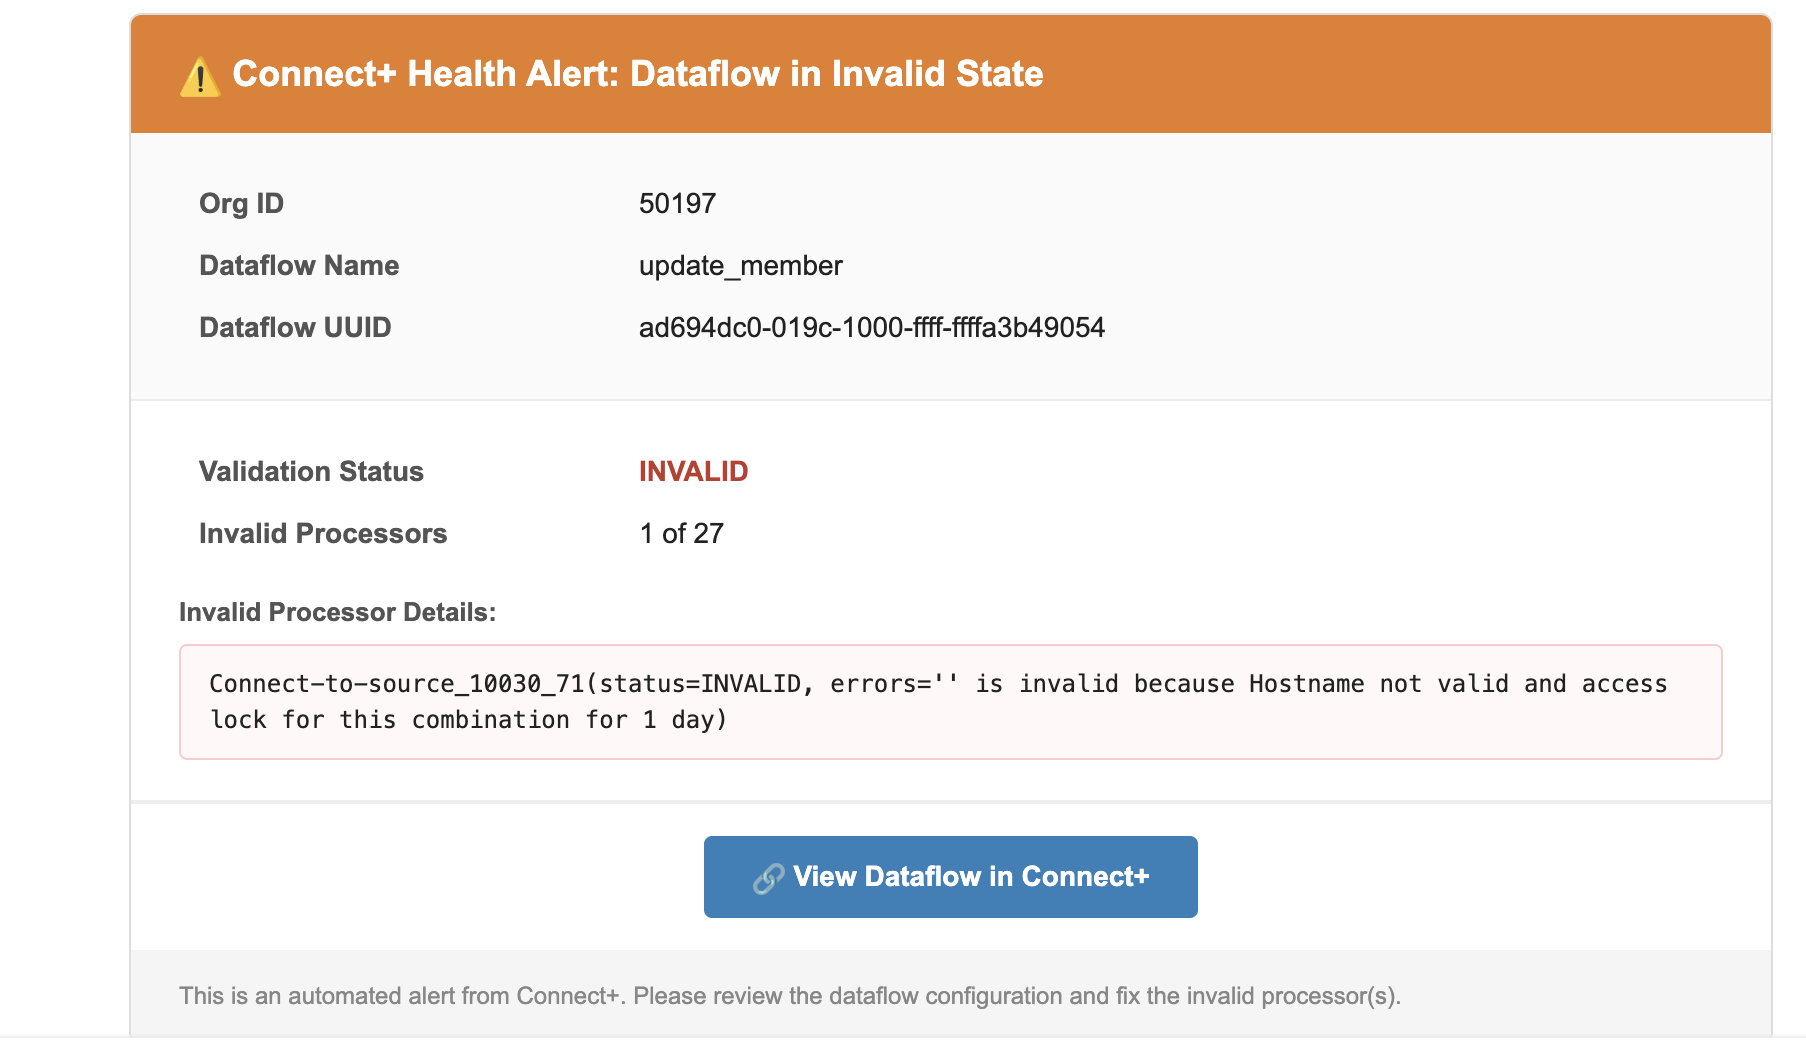
Dataflow validation alert
This alert monitors file-based and stream-based dataflows after they're created. Connect+ runs a scheduled validation check 15 minutes after each dataflow is created to confirm it's configured correctly. If the validation fails, the alert fires. This alert applies at the dataflow level only.
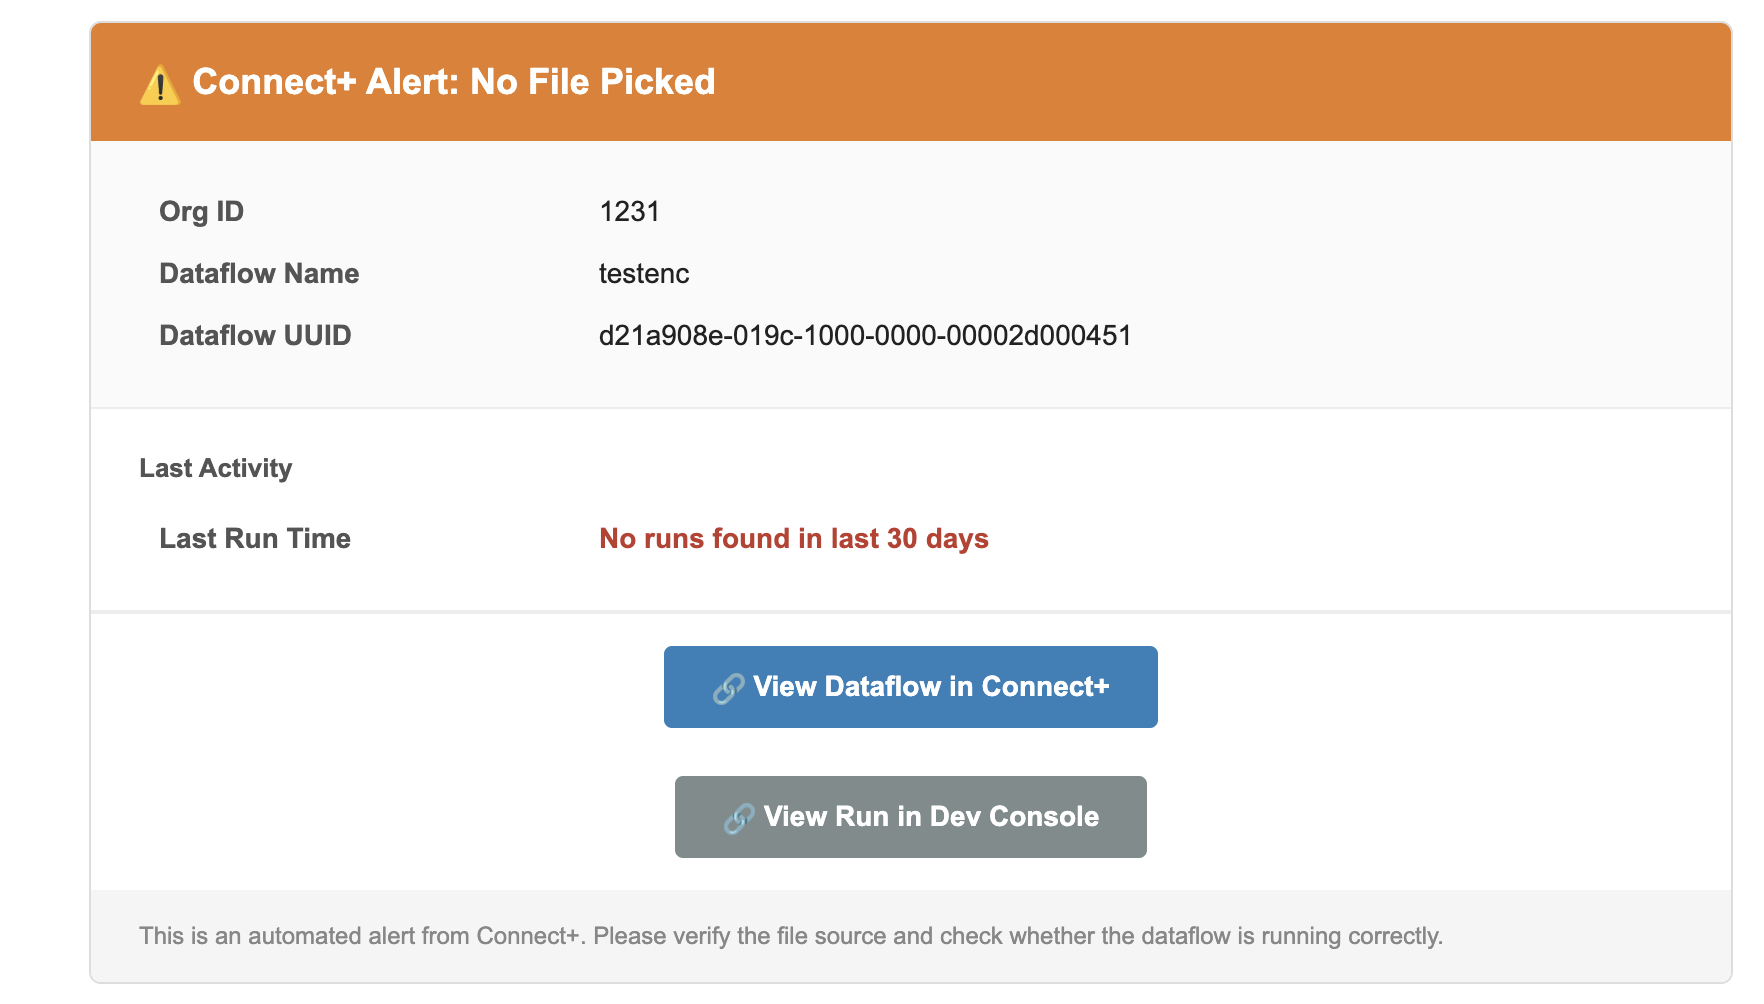
No file picked alert
This alert monitors file-based dataflows for missing file arrivals. It fires when no file is received within a configurable time window that you define. Use it to detect upstream delivery failures before they cause a dataflow to run with missing data. The alert applies at both the dataflow and organization level.
File-level failure alert
This alert fires when a file-based dataflow run completes with 10% or more of its records failing. It applies at both the dataflow and organization level. This is a manual alert. You can set or modify the threshold from Alert Management.
Latency Alert
This alert fires when processing time in a file-based or stream-based dataflow exceeds the threshold you set. It applies at both the dataflow and organization level. This is a manual alert. You can set or modify the threshold from Alert Management.
Partial success
This notification fires when a file-based or stream-based dataflow run completes with 10% or more of records failing all retry attempts within 10 minutes. It applies at both the dataflow and organization level. This is a manual alert. You can set or modify the threshold from Alert Management.
Alert details
When an alert fires, the notification mail includes the following information.
| Field | Description |
|---|---|
| Dataflow | The name of the dataflow where the issue was detected. |
| File | The name of the file that was processed during the run. |
| Lineage ID | The unique identifier assigned to the processed file. Use this ID to trace the file through the pipeline. |
| Status | The outcome of the run. Possible values include Partial Success, Success, and Failure. |
| Started (IST) | The date and time the run started, in IST. |
| Duration | The total time taken to complete the run. |
| Avg. Processing Time | The average time taken to process each record in the run. |
| Total Records | The total number of records submitted for processing. |
| Success | The number and percentage of records that were processed successfully. |
| Failure | The number and percentage of records that failed during processing. |
| Retry Exhausted | The number and percentage of records for which all retry attempts were exhausted without success. |
| Failure Details | A breakdown of failures by status code and category, with a count of records affected by each failure type. |
| View Dataflow in Connect+ | Opens the affected dataflow in Connect+ so you can investigate and take action. |
| View Run in Dev Console | Opens the specific run in the Developer Console for deeper analysis. |
| Error file | The FTP path where the error report for this run is stored. The file contains per-record details for all failed records. |
File processing notifications
Connect+ sends a notification after processing each source file. Notifications are sent in the following scenarios:
- Partial success
- Success
Partial success
This notification fires when a file-based or stream-based dataflow run completes with some records succeeding and others failing. The notification includes the number of successful records, the number of failed records, and failure details for each failed record. It also includes a direct link to the Dev Console where you can review the failures.
Success
This notification fires when a file-based or stream-based dataflow run completes with all records processed successfully. It applies at both the dataflow and organization level.
Updated 3 months ago