
Introduction to the UI
A guide to navigating the Connect+ interface — the home page, dataflow list, workspace selector, performance metrics, and settings.
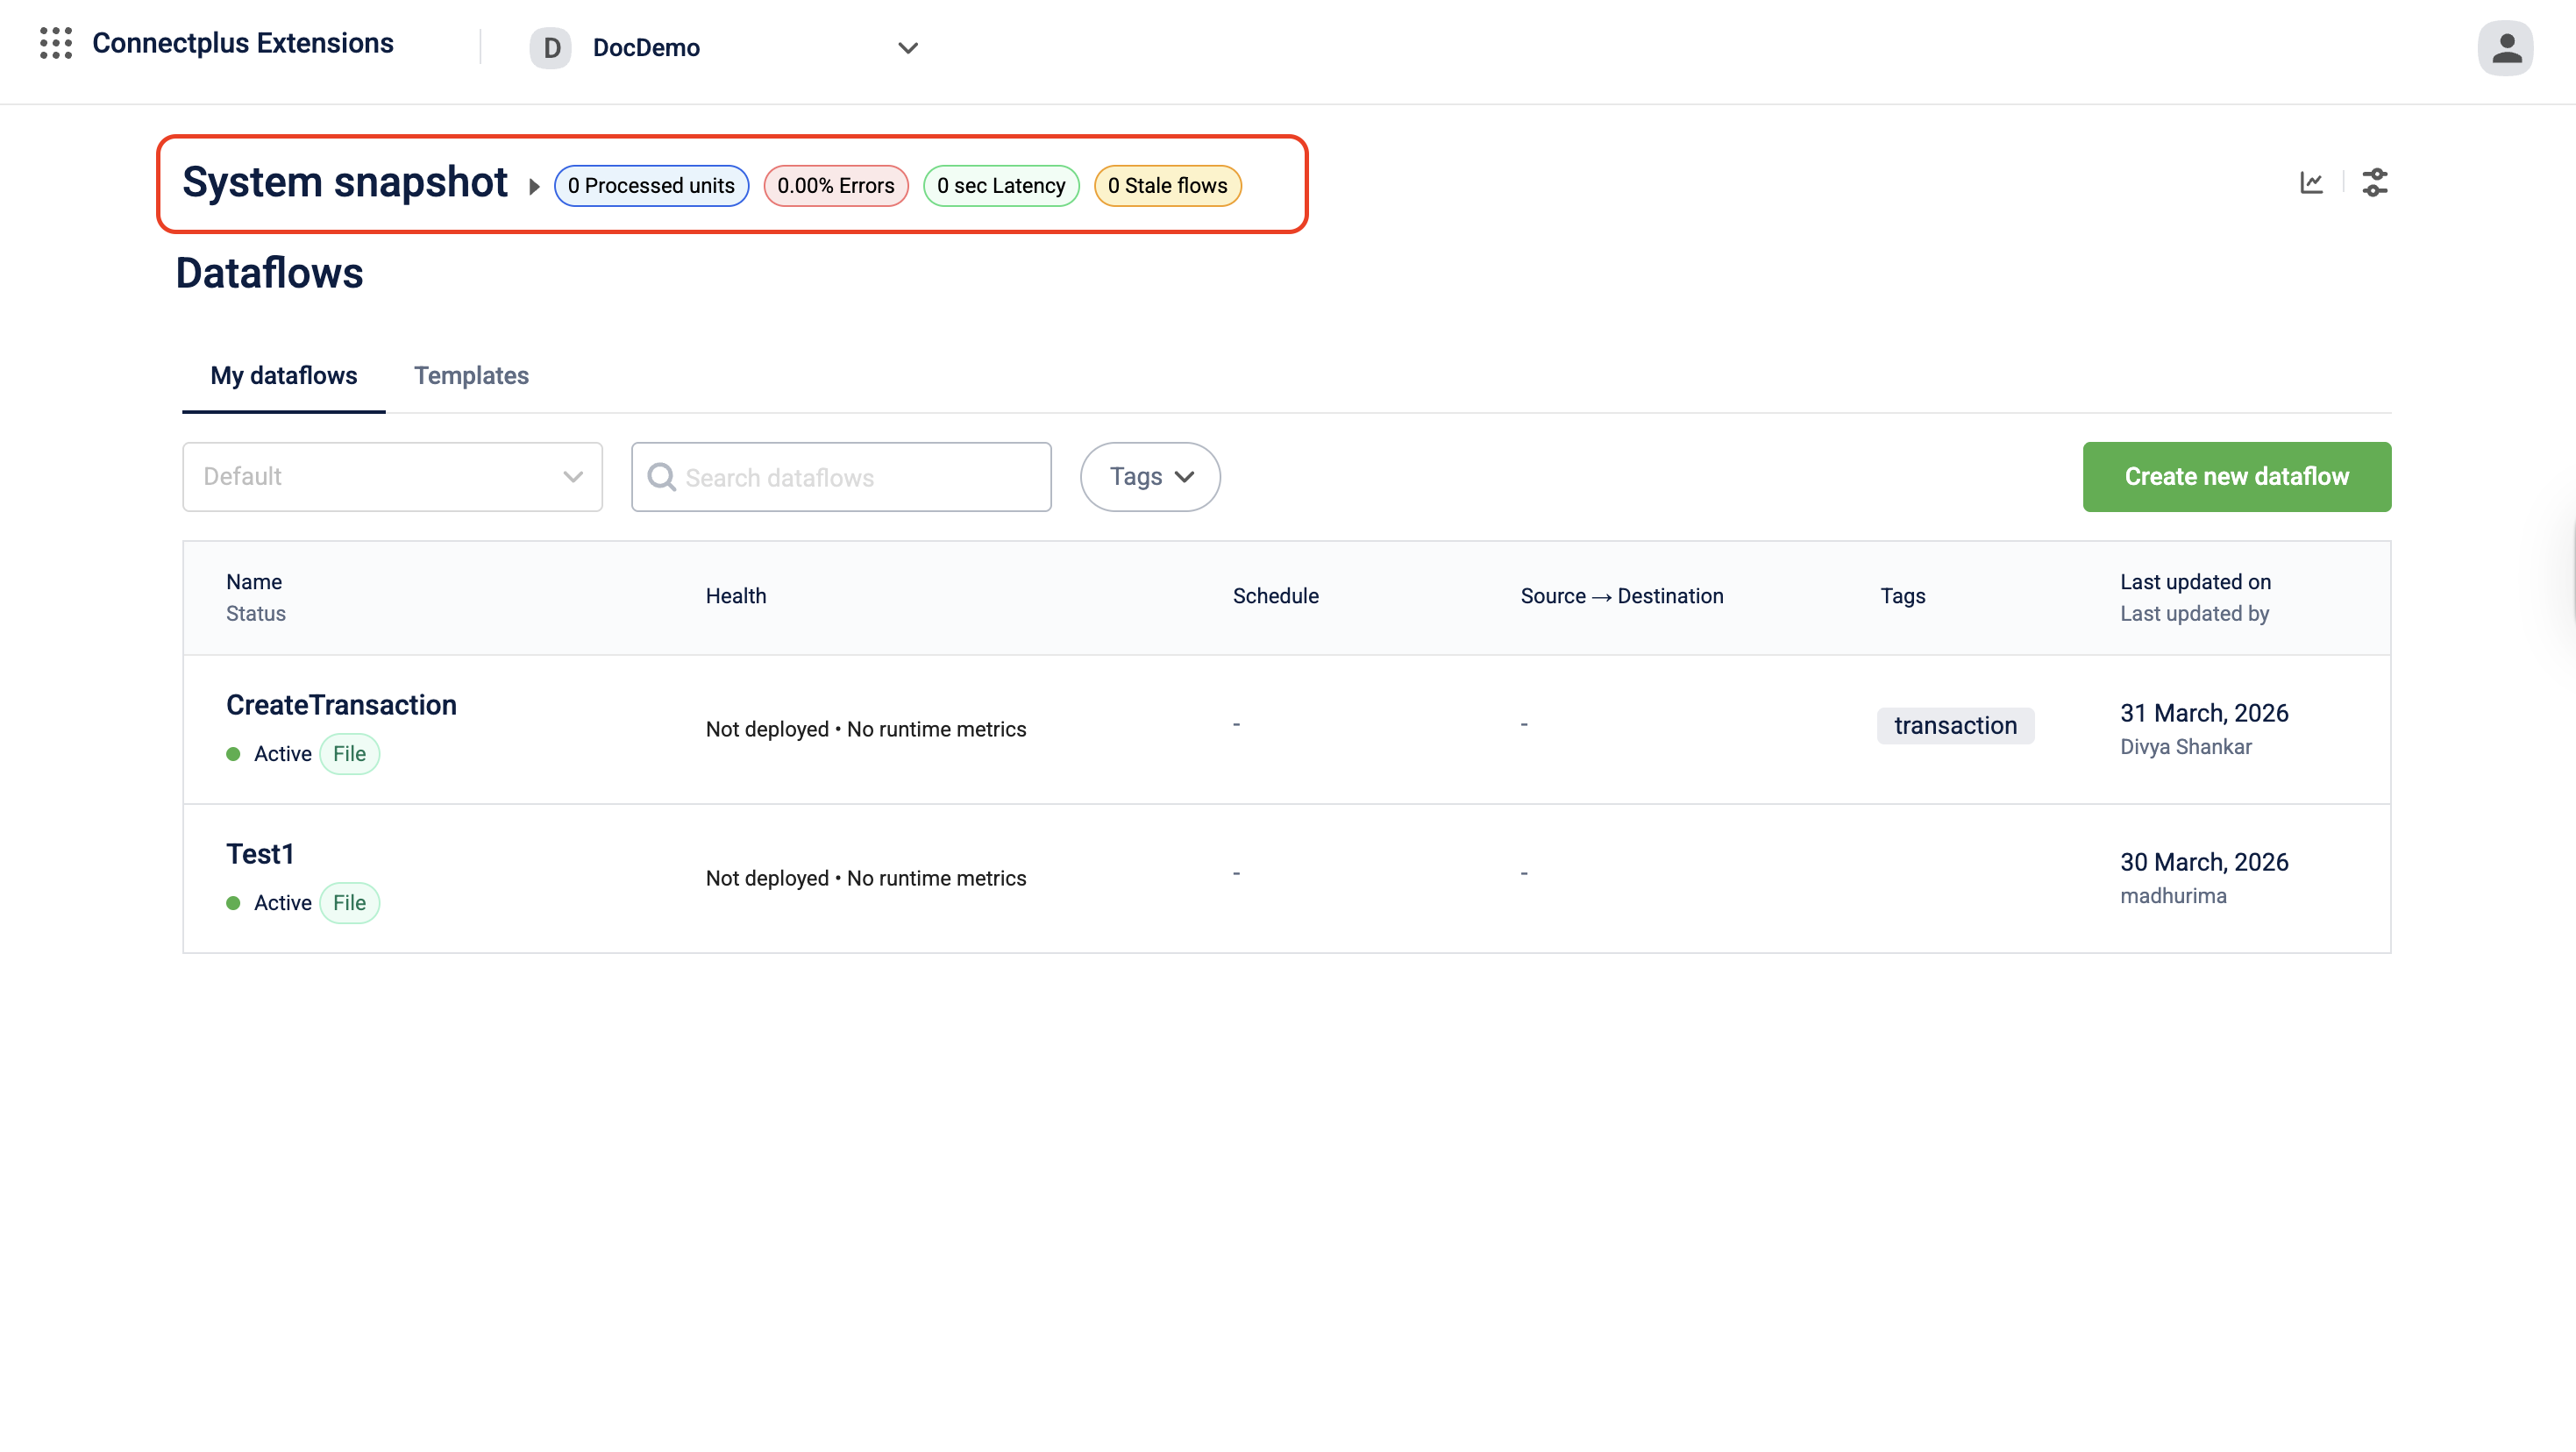
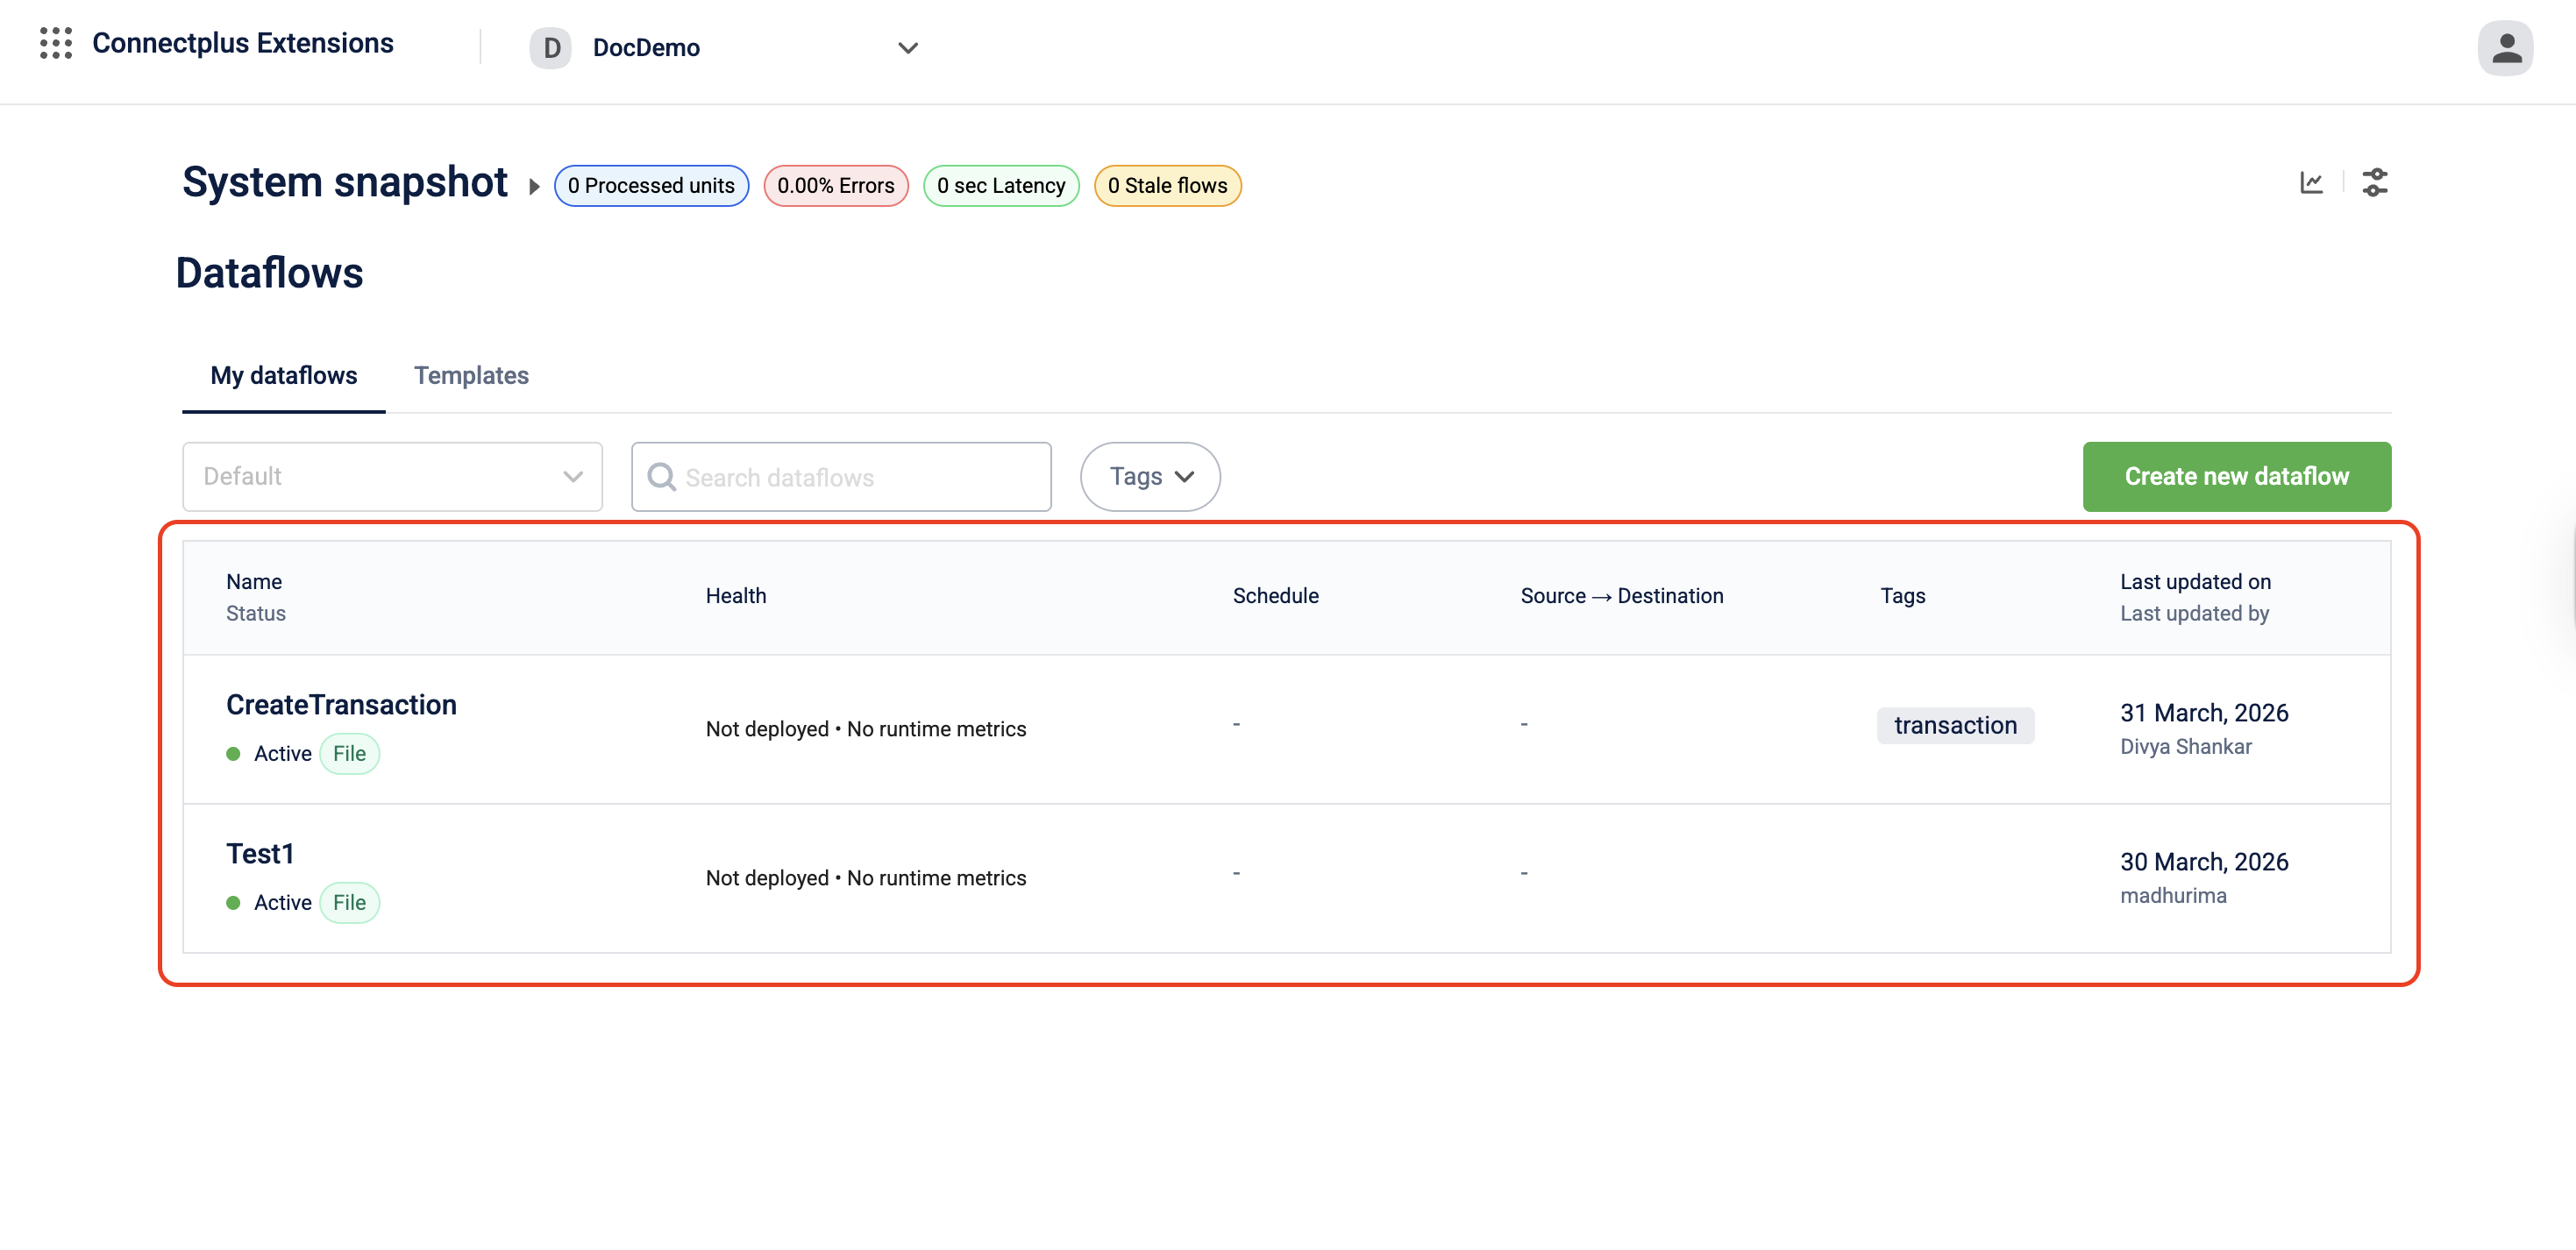
The Connect+ homepage serves as the main interface for managing and monitoring all your dataflows. It provides a real-time overview of your workspace’s health at the top, followed by a comprehensive list of all dataflows.
The page is divided into two sections:
- System Snapshot — Displays real-time, workspace-level performance metrics.
- Dataflows — Lists all dataflows in the workspace, with options to search, filter, and create new dataflows.
System snapshot
The System snapshot section appears at the top of the homepage. It shows aggregate health metrics across all dataflows in the workspace for the selected metrics window. Use it to quickly assess whether your workspace is processing data as expected and whether any errors or slowdowns need attention.
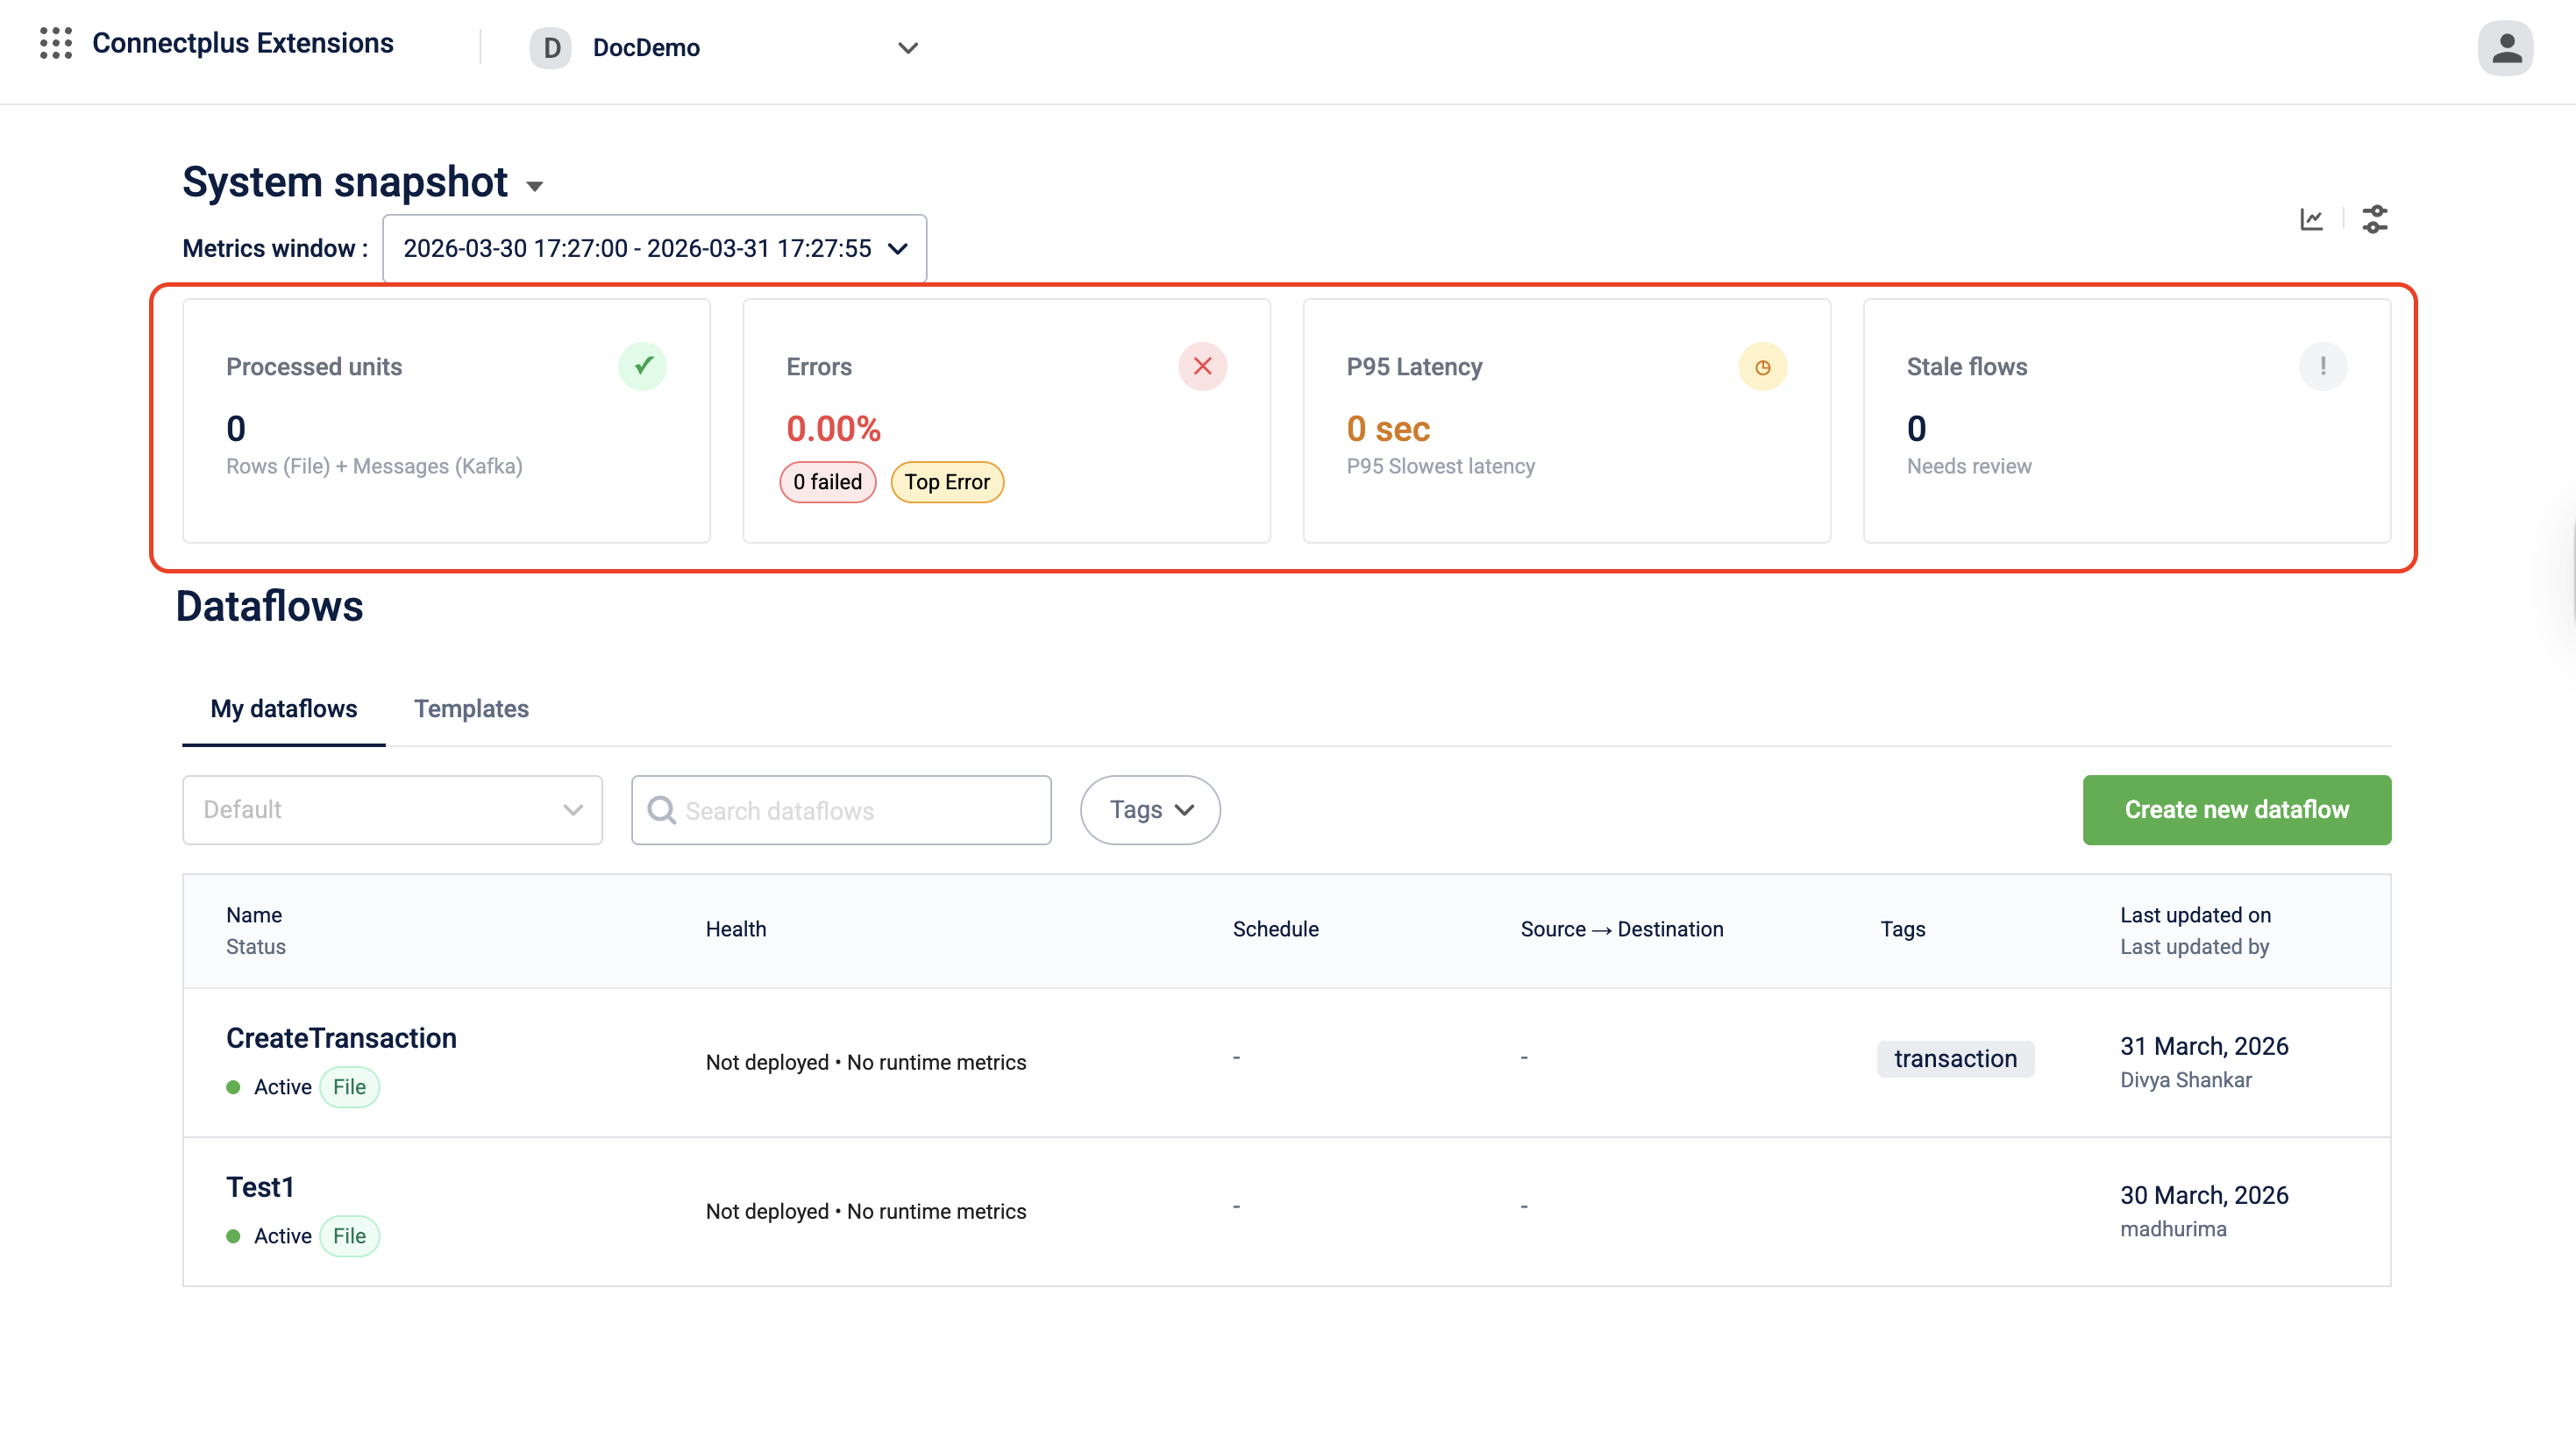
Metrics window
The Metrics window drop-down lets you set the time range for all four metric tiles. The options are preset periods such as Last 1 hour and Last 24 hours, or a Custom Range that lets you define a specific start and end time.
All four metric tiles update when you change the metrics window.
Metric tiles
The four tiles display the following workspace-wide metrics for the selected time window.
| # | Tile | Description |
|---|---|---|
| 1 | Processed units | The total number of records handled by a dataflow within a selected time range. For file-based dataflows, this refers to the number of file rows processed; for stream-based (Kafka) dataflows, this refers to the number of Kafka messages processed. |
| 2 | Errors | The overall error rate as a percentage across all dataflows. Below the percentage, two badges give a quick breakdown: N failed shows the total number of failed records, and Top Error opens a view of the most frequent error code or message recorded in the window. |
| 3 | P95 Latency | The 95th-percentile processing time in seconds. This is the time within which 95% of all records across all dataflows are processed. A value significantly higher than the usual indicates that a small number of records are taking much longer than the majority. |
| 4 | Stale flows | The number of dataflows that have not processed any data for two days. A stale flow may indicate a scheduling issue, a trigger failure, or an upstream source problem. |
Toolbar icons
Two icons appear in the top-right corner of the system snapshot section.
| Icon | Description |
|---|---|
| Trend chart icon (Dataflow Metrics) | Opens the platform metrics in Dev Console so you can see how processed units, errors, P95 latency, and stale flows have changed across the selected window. |
| Filter icon (Configuration Management) | Opens the Configuration Manager in Dev Console under Extensions Configuration. |
Dataflows
The Dataflows section lists all dataflows in the workspace. It has two tabs: My dataflows, which shows the dataflows you have access to, and Templates, which shows pre-built dataflow templates you can use to create new dataflows.
Controls
| Control | Description |
|---|---|
| Sort drop-down | Sorts the dataflow list. Default shows the most recently updated dataflows first. |
| Search bar | Filters the list in real time as you type. Search by dataflow name. |
| Tags | Filters the list by one or more tags. Select Tags to expand the drop-down and choose the tags you want to filter by. |
| Create new dataflow | Opens the dataflow creation flow. Select a template to get started. |
Dataflow list columns
Each row in the list represents one dataflow. The columns are:
| Column | Description |
|---|---|
| Name | The name of the dataflow. Select the name to open the dataflow. Below the name, the Status badge shows whether the dataflow is Active or Inactive. The source type badge (for example, File or Stream) indicates whether the dataflow processes file-based or stream-based data. For inactive dataflows, a version badge such as Live: v3 shows the version number of the most recently live version. |
| Health | It provides a view of a dataflow's last processed time, error rates, latency (P95), and activity status. Displays Not deployed when the dataflow has no active deployment, and No runtime metrics when there is no processing activity within the current metrics window. |
| Schedule | The trigger frequency of the dataflow, for example, Every 5 minutes or Every 9 minutes. Displays a dash when no schedule is configured. |
| Source → Destination | The type of source the dataflow reads from and the type of destination it writes to, for example, Sftp Read → Http Write or Kafka Topic Read → Kafka Topic Read. Displays a dash when the dataflow has no source or destination configured. |
| Tags | The tags assigned to the dataflow. Tags help categorize and filter dataflows across the workspace. |
| Last updated on / Last updated by | The date when the dataflow configuration was last saved, and the name of the user who made the most recent change. |
Dataflow canvas
Opens when you click any version of a dataflow. This is where you build and edit the dataflow.
From the canvas, you can:
- Save, send for approval, or make a version live
- Start, stop, or pause a live dataflow
- Sync credentials from the vault manager
- Compare different versions of a dataflow
Note: The compare icon is available only when the dataflow is in theDraftstate. - Restore the current version to the previously approved version.
- Open Aira Coder
The canvas shows two status indicators. The version state tracks the lifecycle of the configuration: Draft, Awaiting Approval, Approved, and Live. The backend status tracks whether the dataflow is actively processing data. These two are independent of each other.
Dataflow versions
Every dataflow in Connect+ is version-controlled. Changes are always made on the latest Draft version. Once changes are ready, send the draft for approval. The version lifecycle is:
Draft → Awaiting Approval → Approved → LiveOnly one version of a dataflow can be Live at a time. You can view any past version, compare changes between versions, or restore the most recently approved version if needed.
It takes approximately 10 minutes for a version to become Live after approval.
Dataflow controls
Use the following controls to manage a live dataflow:
| Control | Behavior |
|---|---|
| Stop | Halts all processing immediately |
| Start | Restarts a stopped dataflow |
| Sync | Re-applies the latest Vault Manager configurations to all blocks |
aiRA Coder
Connect+ includes an integrated AI assistant, aiRA Coder, that helps you work with dataflows conversationally. You can use it to:
- Explain an existing dataflow — aiRA Coder reads the current configuration and generates a plain-language summary of what the flow does.
- Create a new dataflow from a prompt — describe your requirement and aiRA Coder generates the appropriate block sequence, including transformation scripts.
- Copy and paste dataflows — copy a dataflow's configuration and paste it into a new flow, enabling reuse across orgs without rebuilding from scratch.
Updated 3 months ago