
Alert Management
Overview
Alert Management provides organization-level monitoring in a multi-organization platform. Alerts are evaluated independently for each organization instead of using aggregated platform metrics. This ensures that issues affecting a single organization are detected even when the overall platform appears healthy.
By supporting organization-specific thresholds, API scoping, and notifications, Alert Management delivers a dedicated monitoring experience on shared infrastructure. This enables proactive issue detection, faster resolution, and improved customer trust.
The system is built on New Relic and supports monitoring across backend platforms (Core and Extensions) as well as UI extensions.
Purpose
Traditional monitoring focuses on platform-level metrics, which can overlook issues affecting individual organizations. Alert Management addresses this limitation by enabling:
- Organization-specific alerting to detect customer issues early
- Proactive issue detection before escalation
- Reduced Mean Time to Resolution (MTTR) through contextual alerts
- Actionable alerts instead of generic or noisy notifications
- Improved customer trust and stability perception
Supported platforms
Alert Management supports monitoring and alerting across the following platform layers:
Extension-Based Applications
Supports alert configuration for the Vulcan UI extension and backend extensions such as Neo, Classic Extensions, and Vulcan applications. This allows organizations to monitor extension-level metrics and identify issues within extension workflows.
Core Platform APIs
Supports core services such as intouch-api and intouch-api-v3, allowing organizations to track API health, performance, and error conditions at the platform layer.
Before using Alert Management, ensure the required setup components are available.
Prerequisites
Before using Alert Management, ensure the following are available:
- A Slack channel to receive alerts
- A Slack webhook URL for the channel
- Dev Console access as a Dev Console External Tech Lead or Dev Console External Developer
Once prerequisites are met, access is controlled through defined user roles.
Access and permissions
Alert Management uses role-based access control to protect configuration settings while allowing operational actions.
| Role | Permissions |
|---|---|
| Dev Console External Tech Lead | • Add and update Slack webhook URLs • Create, view, edit, disable, and delete alert conditions • View all triggered alerts in the Issues page • Acknowledge and close alerts |
| Dev Console External Developer | • View alert conditions and triggered alerts • Acknowledge and close alerts |
With permissions in place, the next section describes how Alert Manager is organized in the Dev Console.
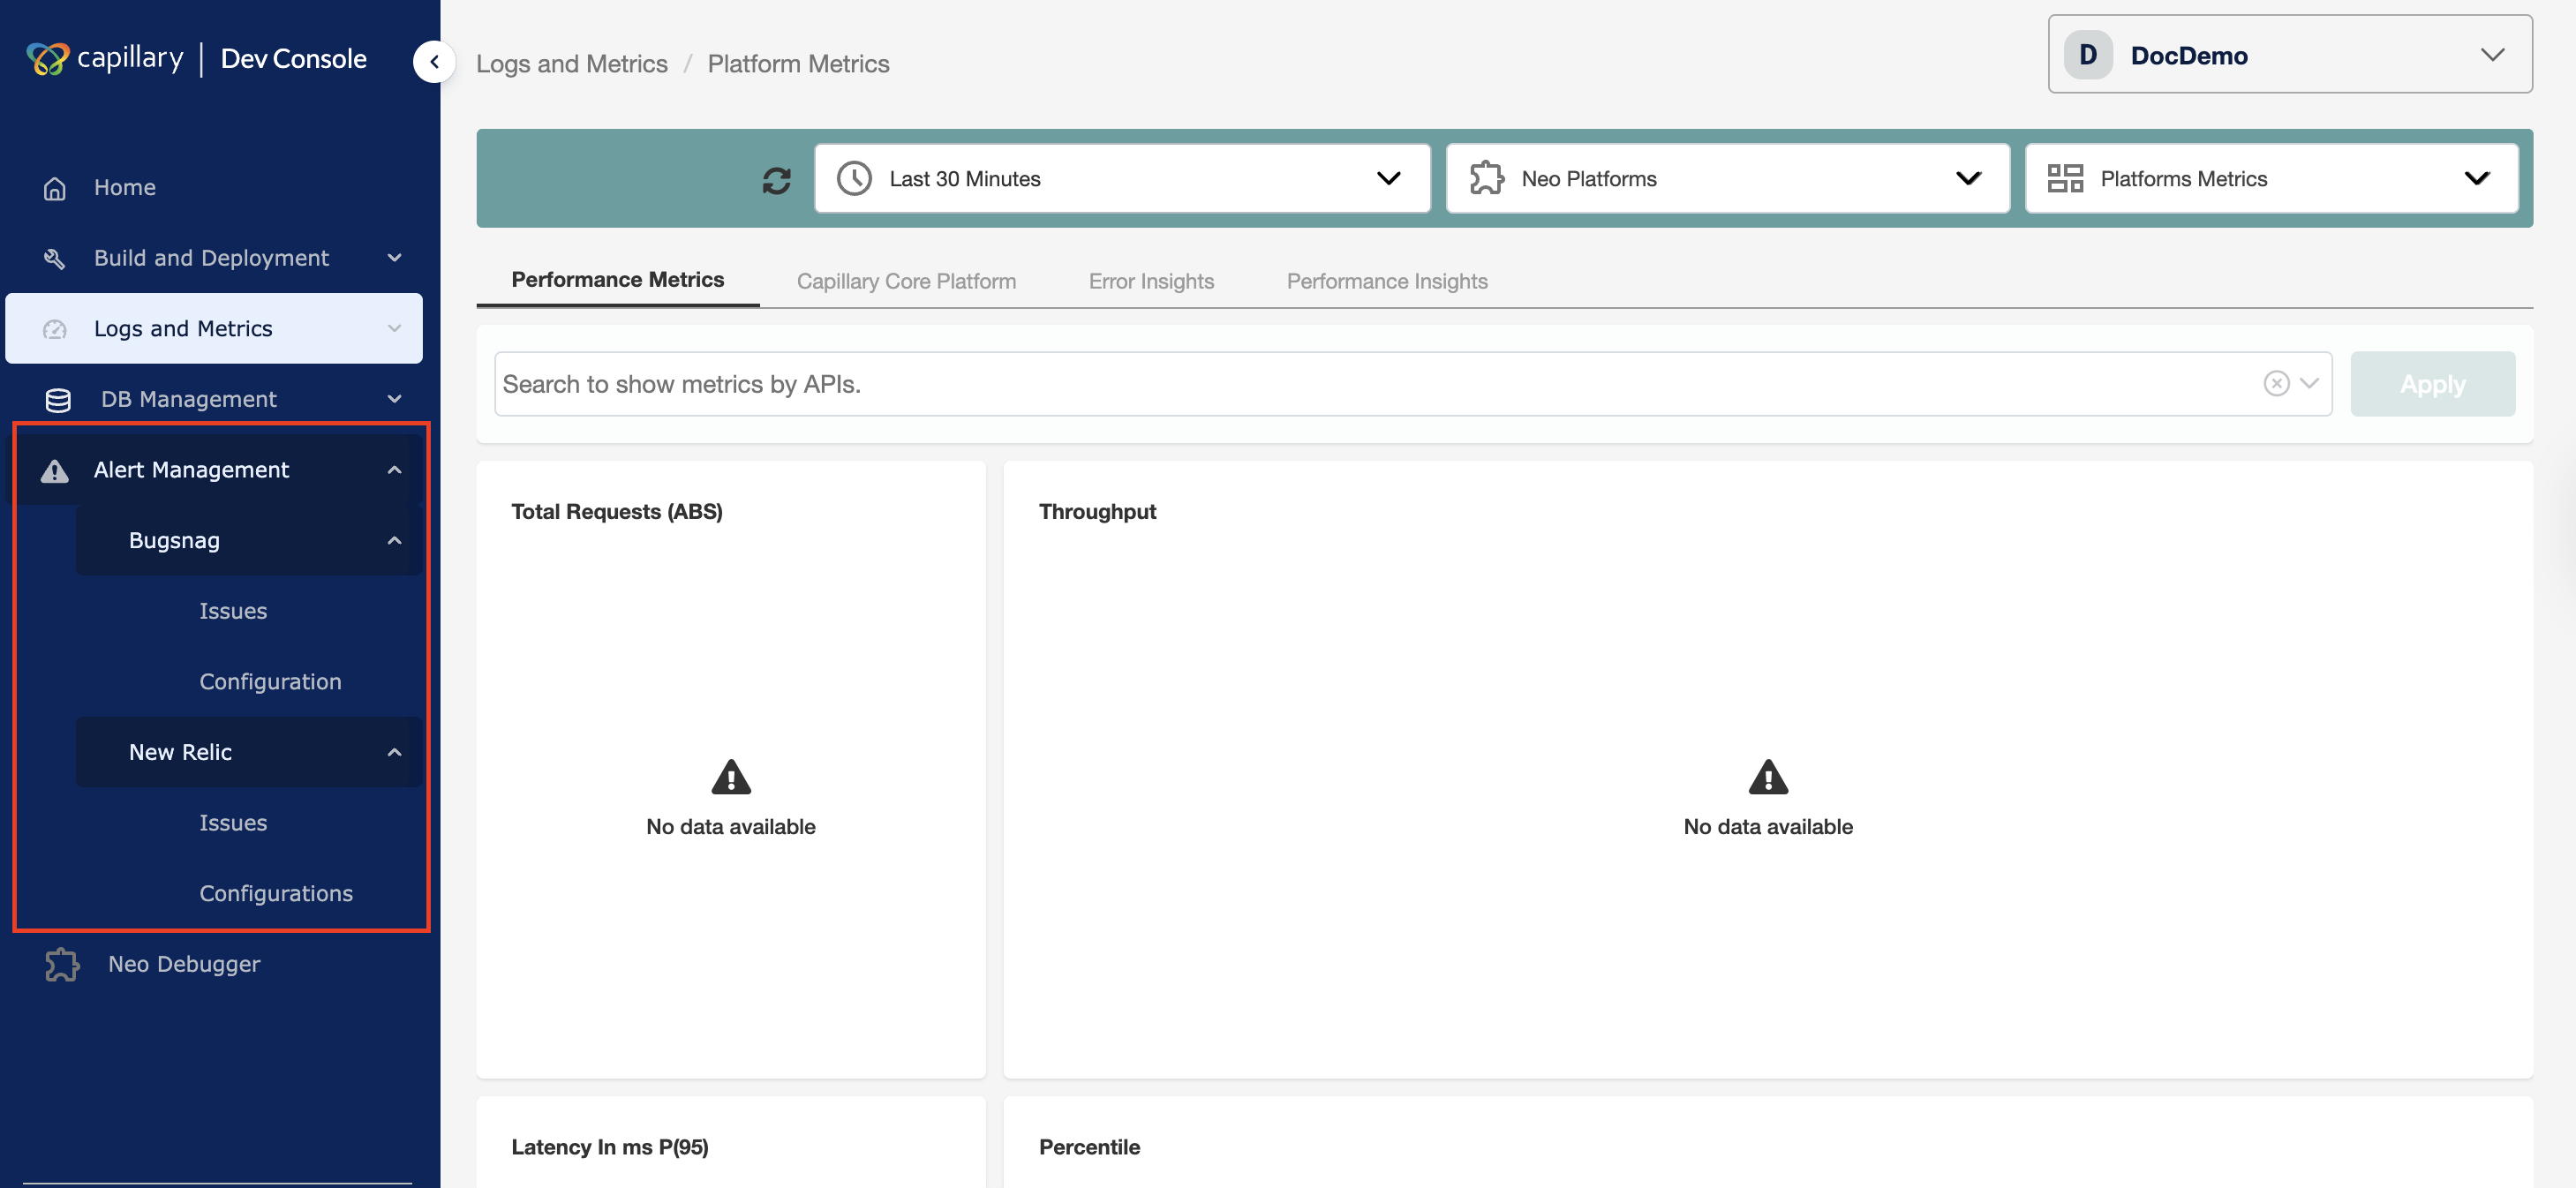
Alert Manager UI structure
You can access Alert Manager from the Dev Console.
Alert Manager includes two monitoring tools:
- New Relic — Monitors backend extensions and core platform services
- BugSnag — Monitors UI extensions (Vulcan applications)
Both tools provide the same functional pages that support the alert lifecycle:
- Issues — Displays all current alerts for the selected time range
- Configuration — Configures the Slack webhook and communication channel, and manages alert conditions
If the initial setup is not completed, both the Issues and Configuration pages under New Relic display the Slack setup screen.
The next section summarises Alert Management's capabilities for organizations and operators.
Features
Alert Management provides the following capabilities:
- Organization-level alerting — Detects and triggers alerts independently for each organization without relying on aggregated platform metrics
- Configurable alert conditions — Defines alert rules based on platforms, APIs, metrics, and thresholds
- Metric-based monitoring — Tracks error rates, latency percentiles, and throughput
- API-level scope control — Applies alerts to all APIs or selected APIs
- Role-based access control — Protects configuration while allowing operational actions
- Notification integration — Sends real-time alerts to configured Slack channels
- Alert lifecycle management — Supports trigger, acknowledgement, and closure
- Issues tracking and visibility — Provides centralized filtering and monitoring of alerts
- Alert condition management — Creates, edits, disables, and deletes alert rules
- Noise reduction — Minimizes alert fatigue using threshold and duration controls
- Audit history — Retains alert events and user actions for analysis
The next section explains how alerts progress from detection to resolution.
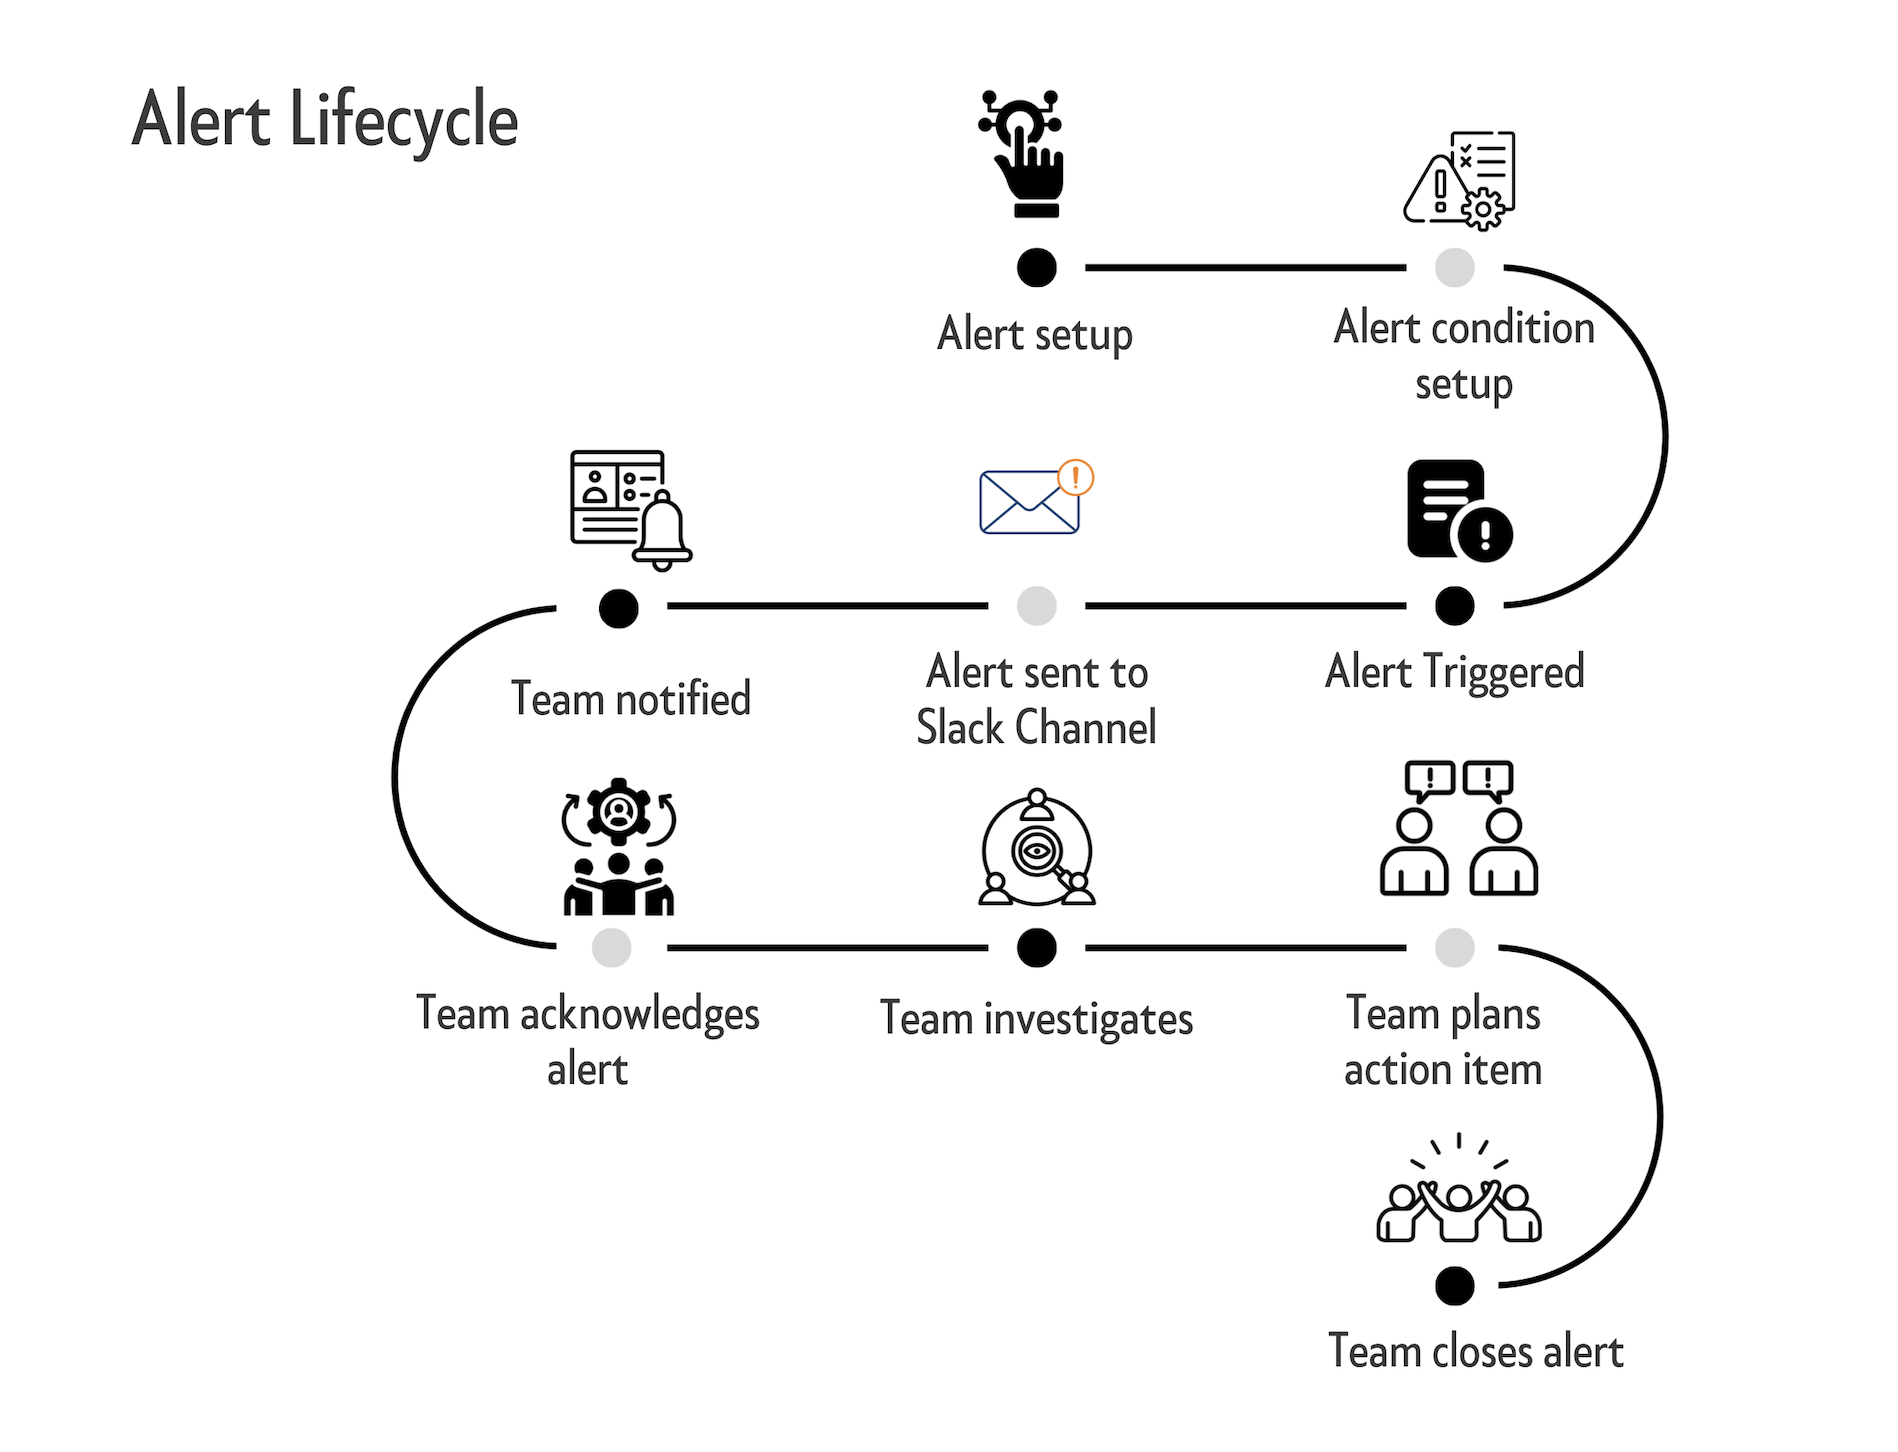
Alert lifecycle
The alert lifecycle describes how an alert progresses from configuration to resolution. Each stage represents a defined operational step from detection to closure.
- Alert setup: Alerting is enabled for the organization and notification channels are configured.
- Alert condition setup: Users create alert rules by defining metrics, thresholds, duration, and scope. The system continuously evaluates telemetry against these rules.
- Alert triggered: The system detects a threshold violation and creates an active alert.
- Alert sent to Slack channel: The alert is delivered to the configured Slack webhook with organization and violation details.
- Team notified: The team receives the alert and begins an investigation.
- Team acknowledges alert: A team member acknowledges the alert to indicate ownership and prevent duplicate effort.
- Team investigates: The team analyzes the issue to determine the root cause.
- Team plans action: The team defines corrective or mitigation steps.
- Team closes alert: The alert is closed after resolution and retained for audit and historical reference.
Complete the one-time setup to begin using Alert Management.
New Relic alert setup
New Relic alert setup allows you to configure organization-level alert conditions and notification channels from Dev Console. It provides centralized control to create, monitor, and manage backend alerts.
In New Relic Alert Manager, an issue can have the following statuses:
- Active: An alert is currently triggered and requires attention.
- Acknowledged: A user has acknowledged the alert and is investigating it.
- Closed: The issue is resolved and the alert is no longer active.
You configure alert conditions from the Configuration page.
Configuration
Alert Manager requires a one-time setup to configure the Slack webhook used for alert notifications. After setup, you can update the webhook and create alert conditions.
Creating a webhook
-
Log in to Dev Console for your organization.
-
Navigate to Alert Management → New Relic → Configuration.
-
Enter the Slack webhook URL for the alert channel.
-
Click Submit.
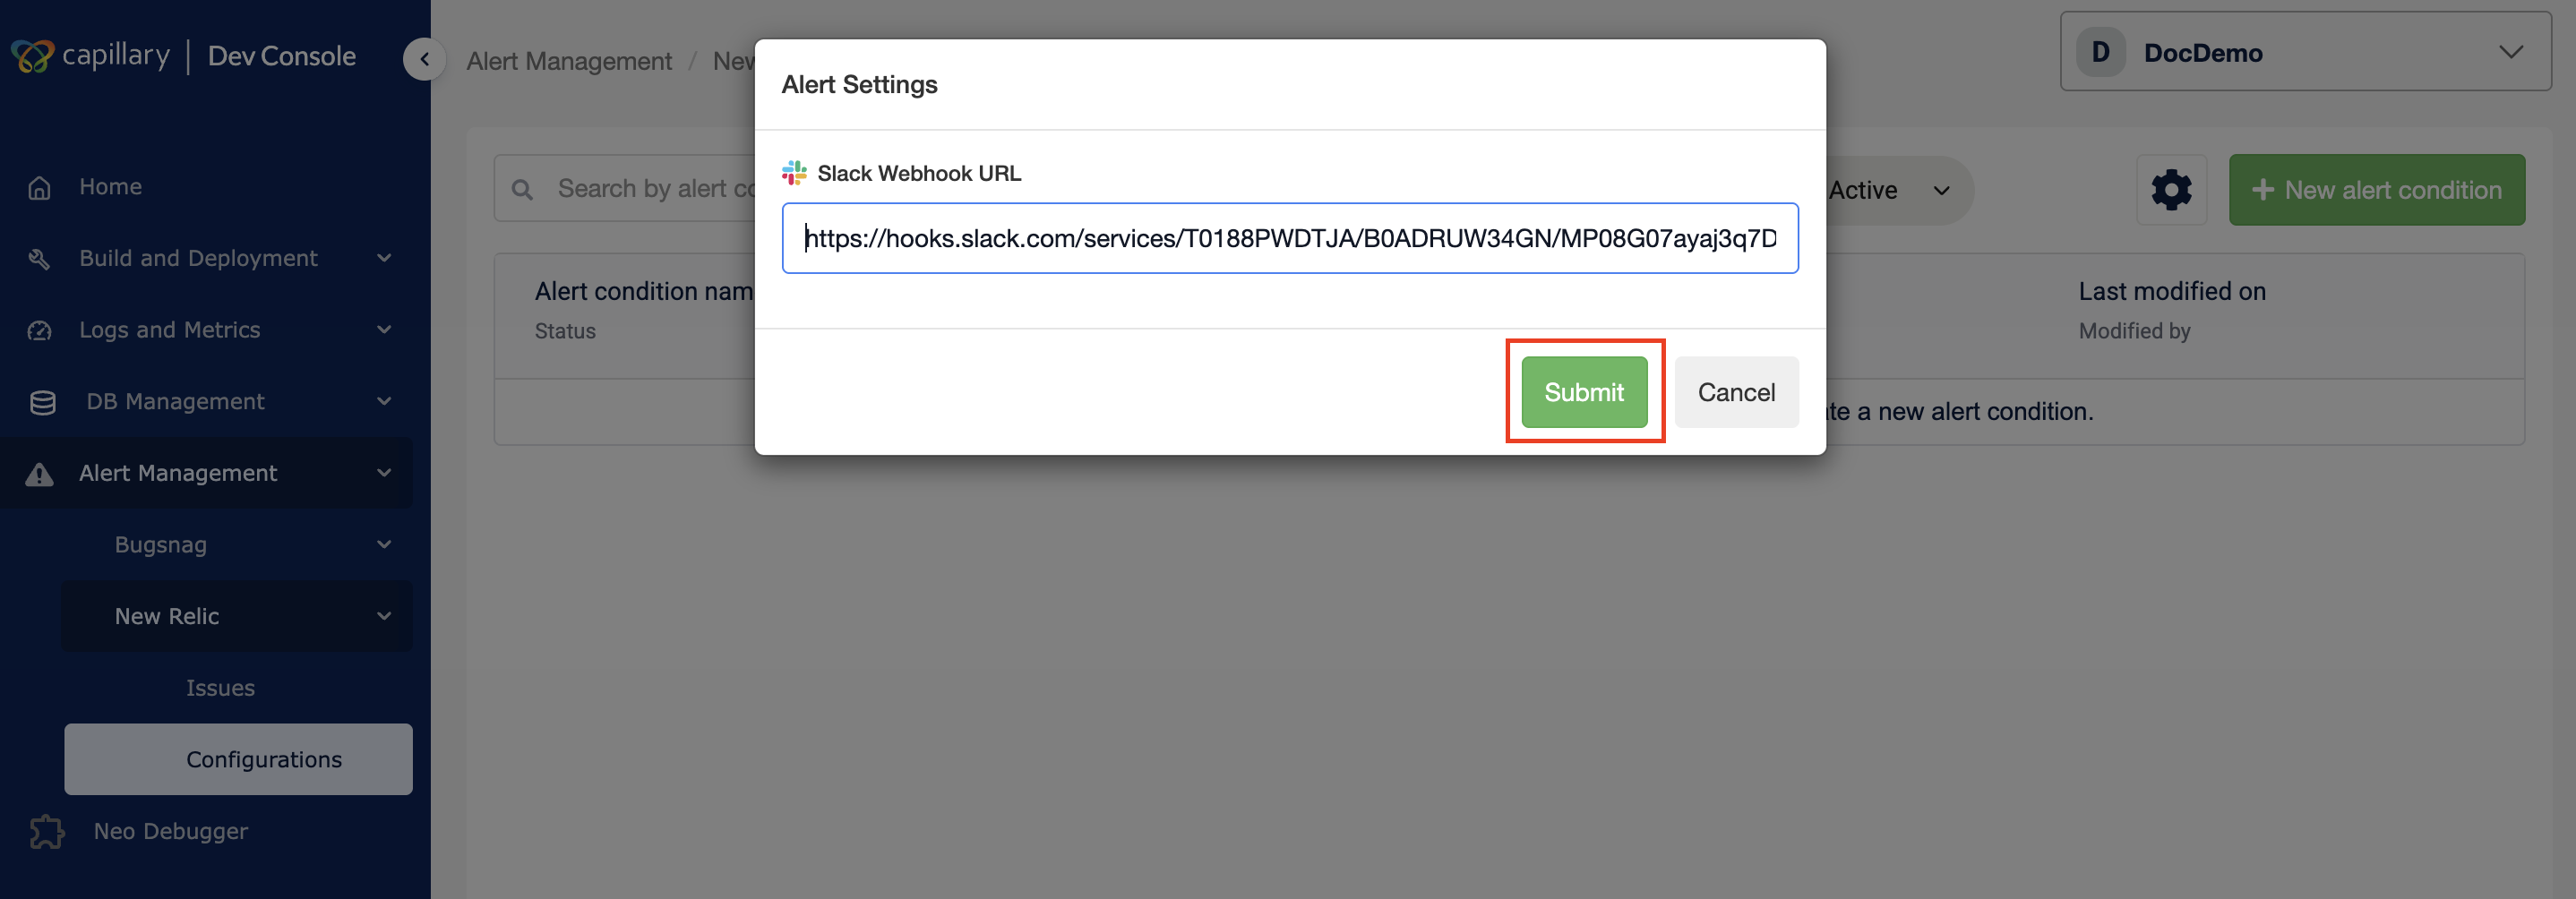
Setup completes after the webhook is saved. You can now create alert conditions.
Note: Until the webhook is configured, both the Issues and Configuration pages redirect to the Slack setup screen.
Editing the webhook
You can update the webhook URL at any time.
-
Navigate to Alert Management → New Relic → Configuration in Dev Console.
-
Click the Settings icon (⚙️).
-
Click Edit in the Alert Settings modal.
-
Enter the new webhook URL.
-
Click Submit.
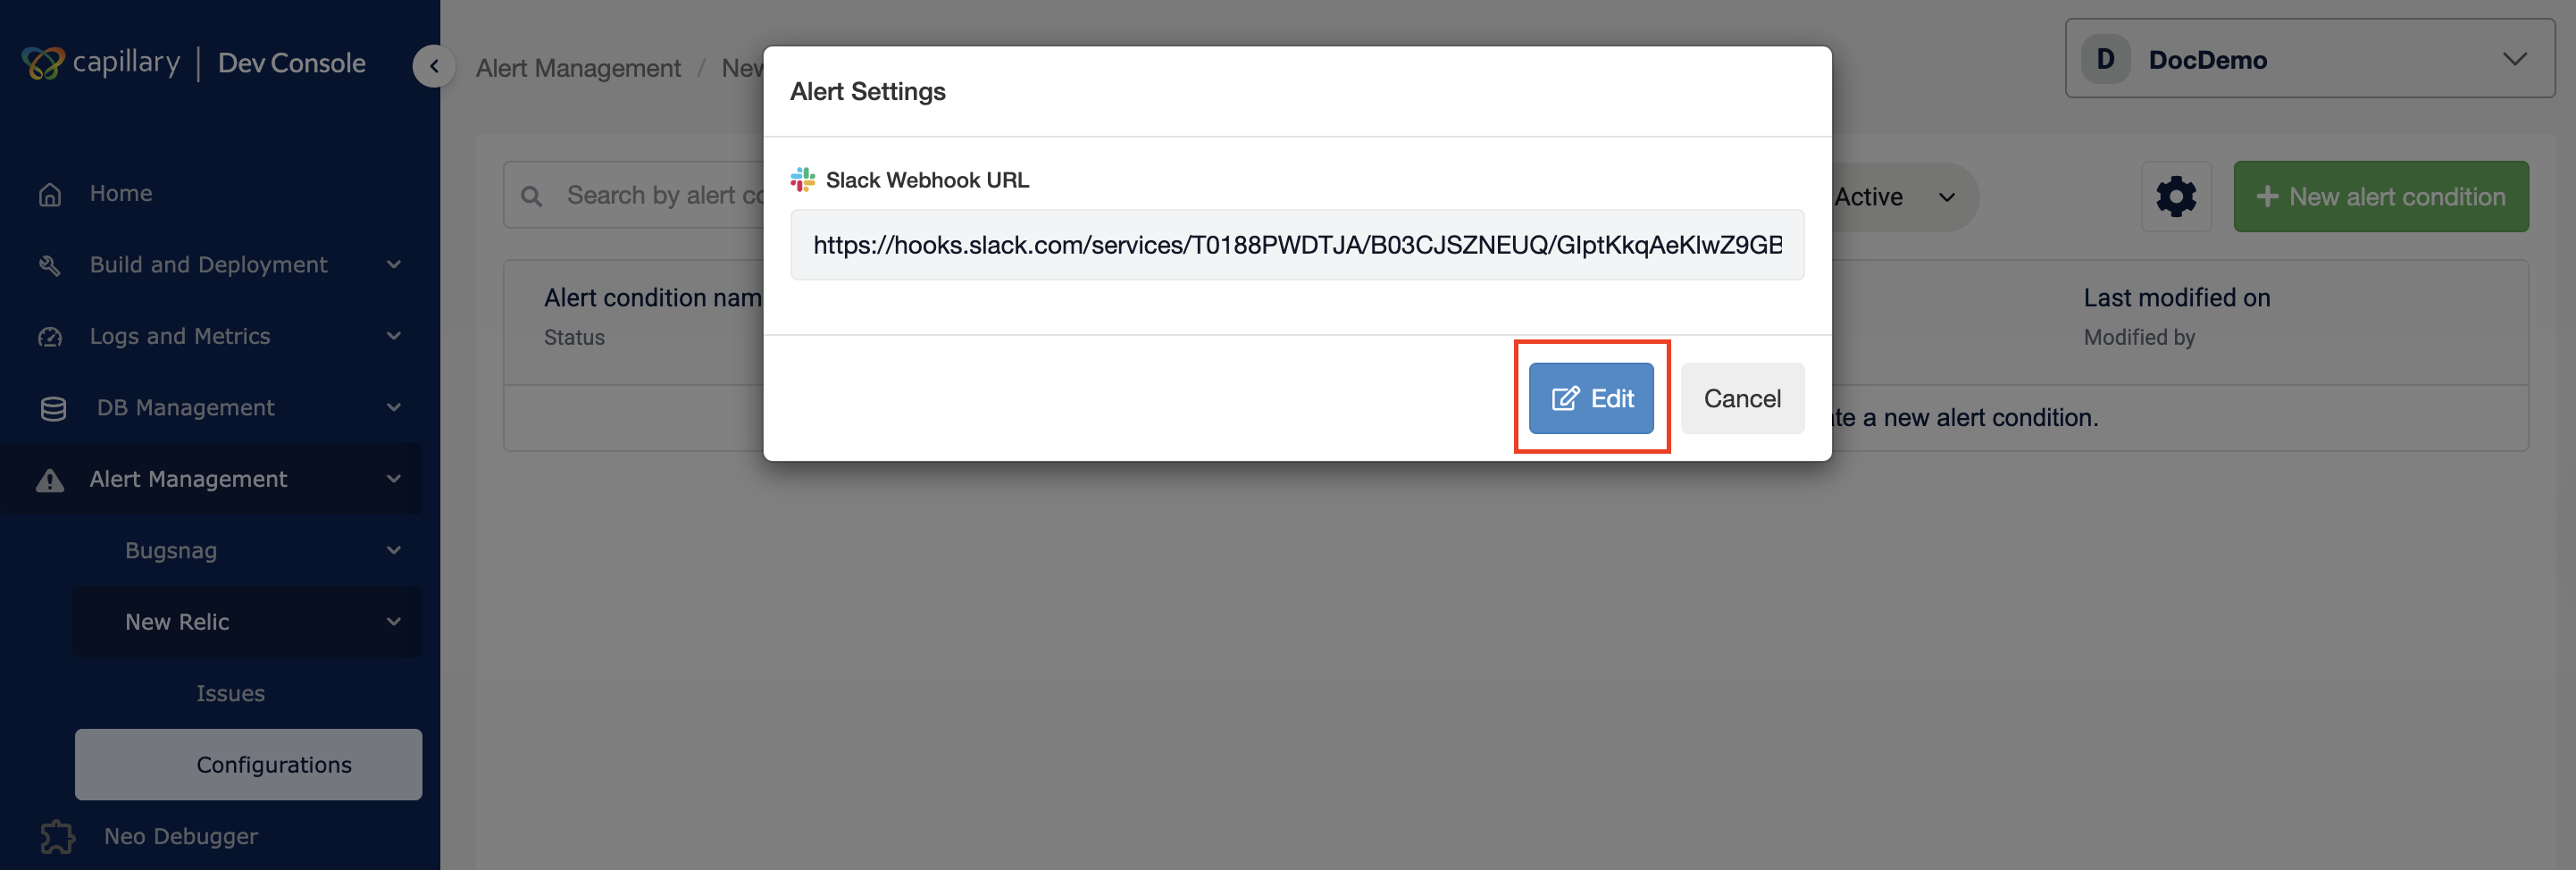
A confirmation message appears after the update completes.
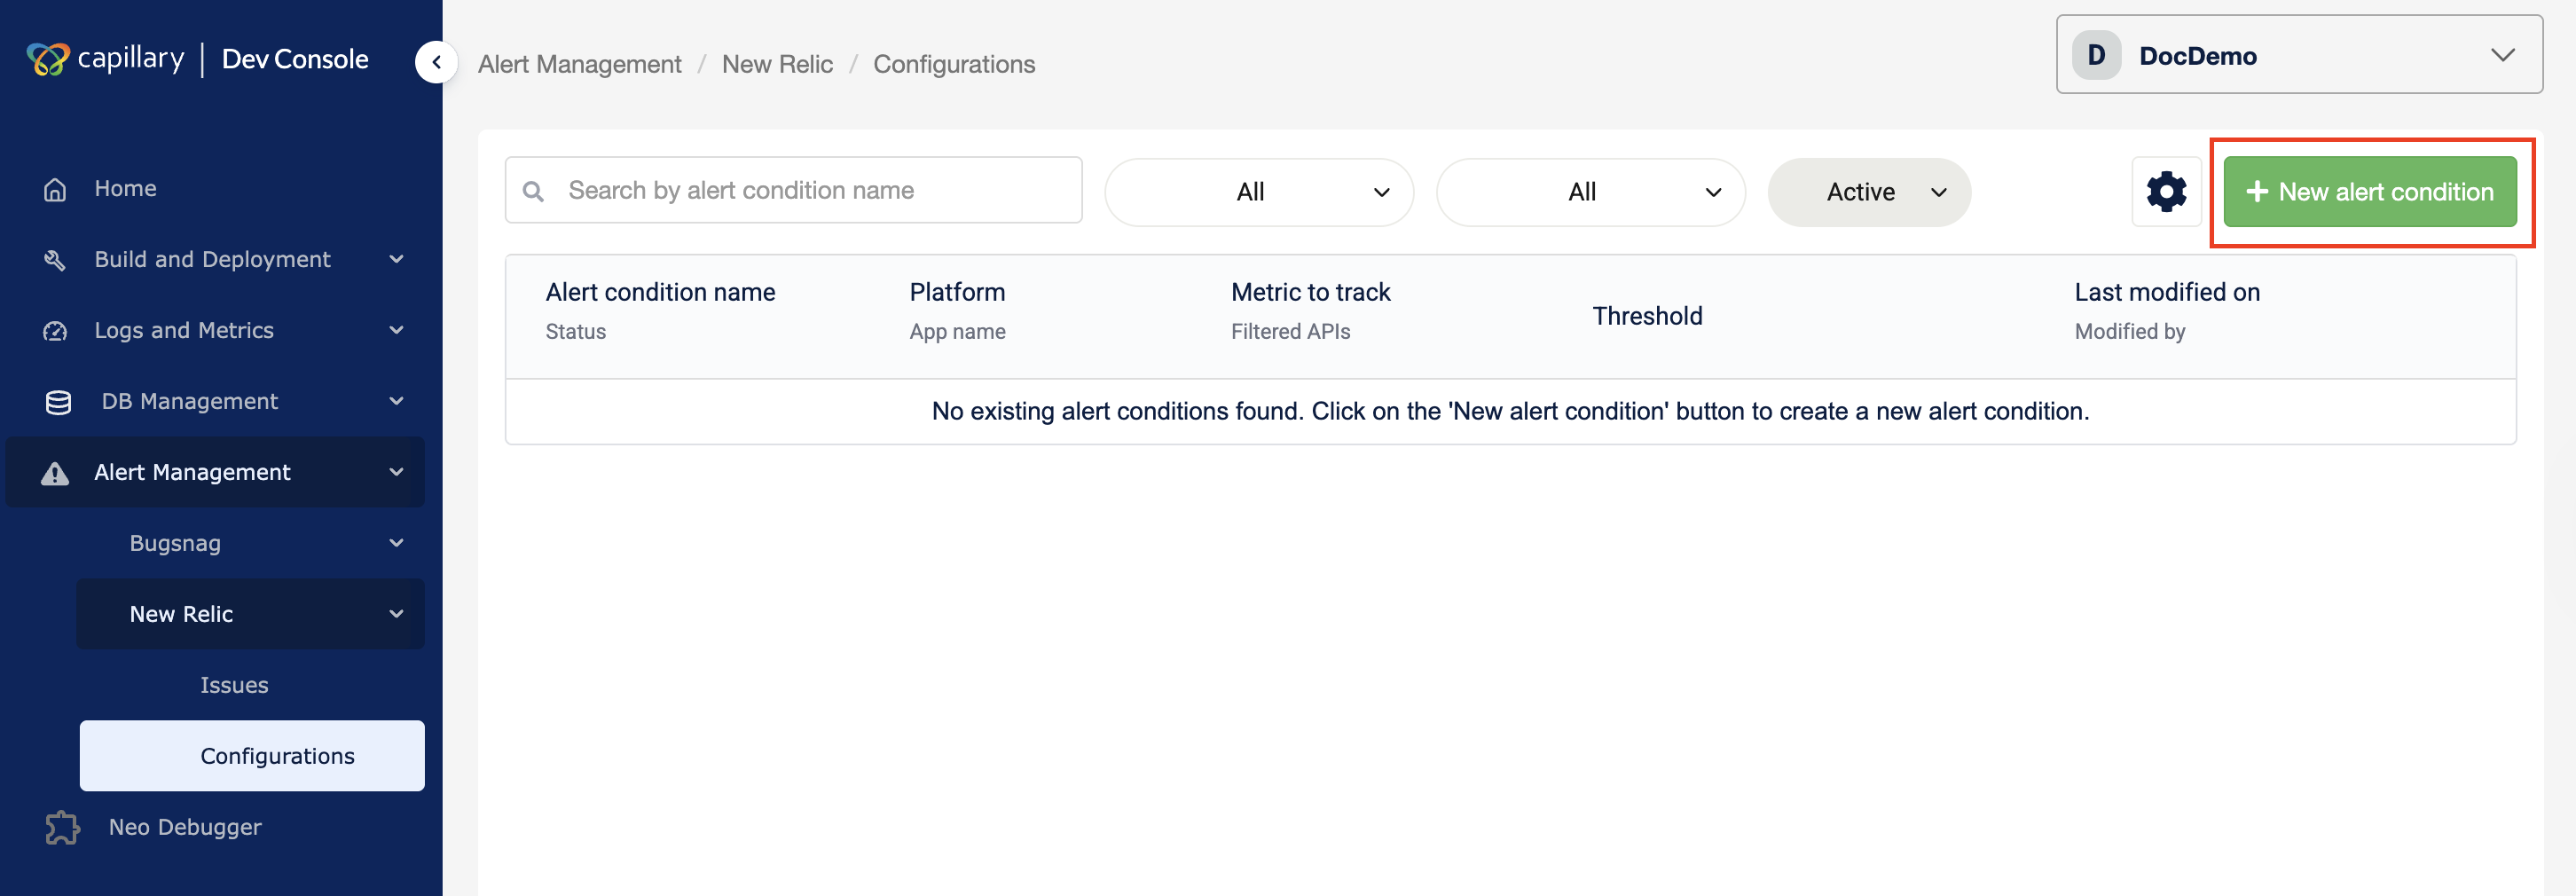
Create alert condition
You can create an alert condition to define what the system monitors and when it triggers an alert. Alert conditions let you track specific metrics, set thresholds, and control how incidents are detected.
To create an alert condition,
-
Navigate to Alert Management → New Relic → Configuration in the Dev Console.
-
Click New Alert Condition.
-
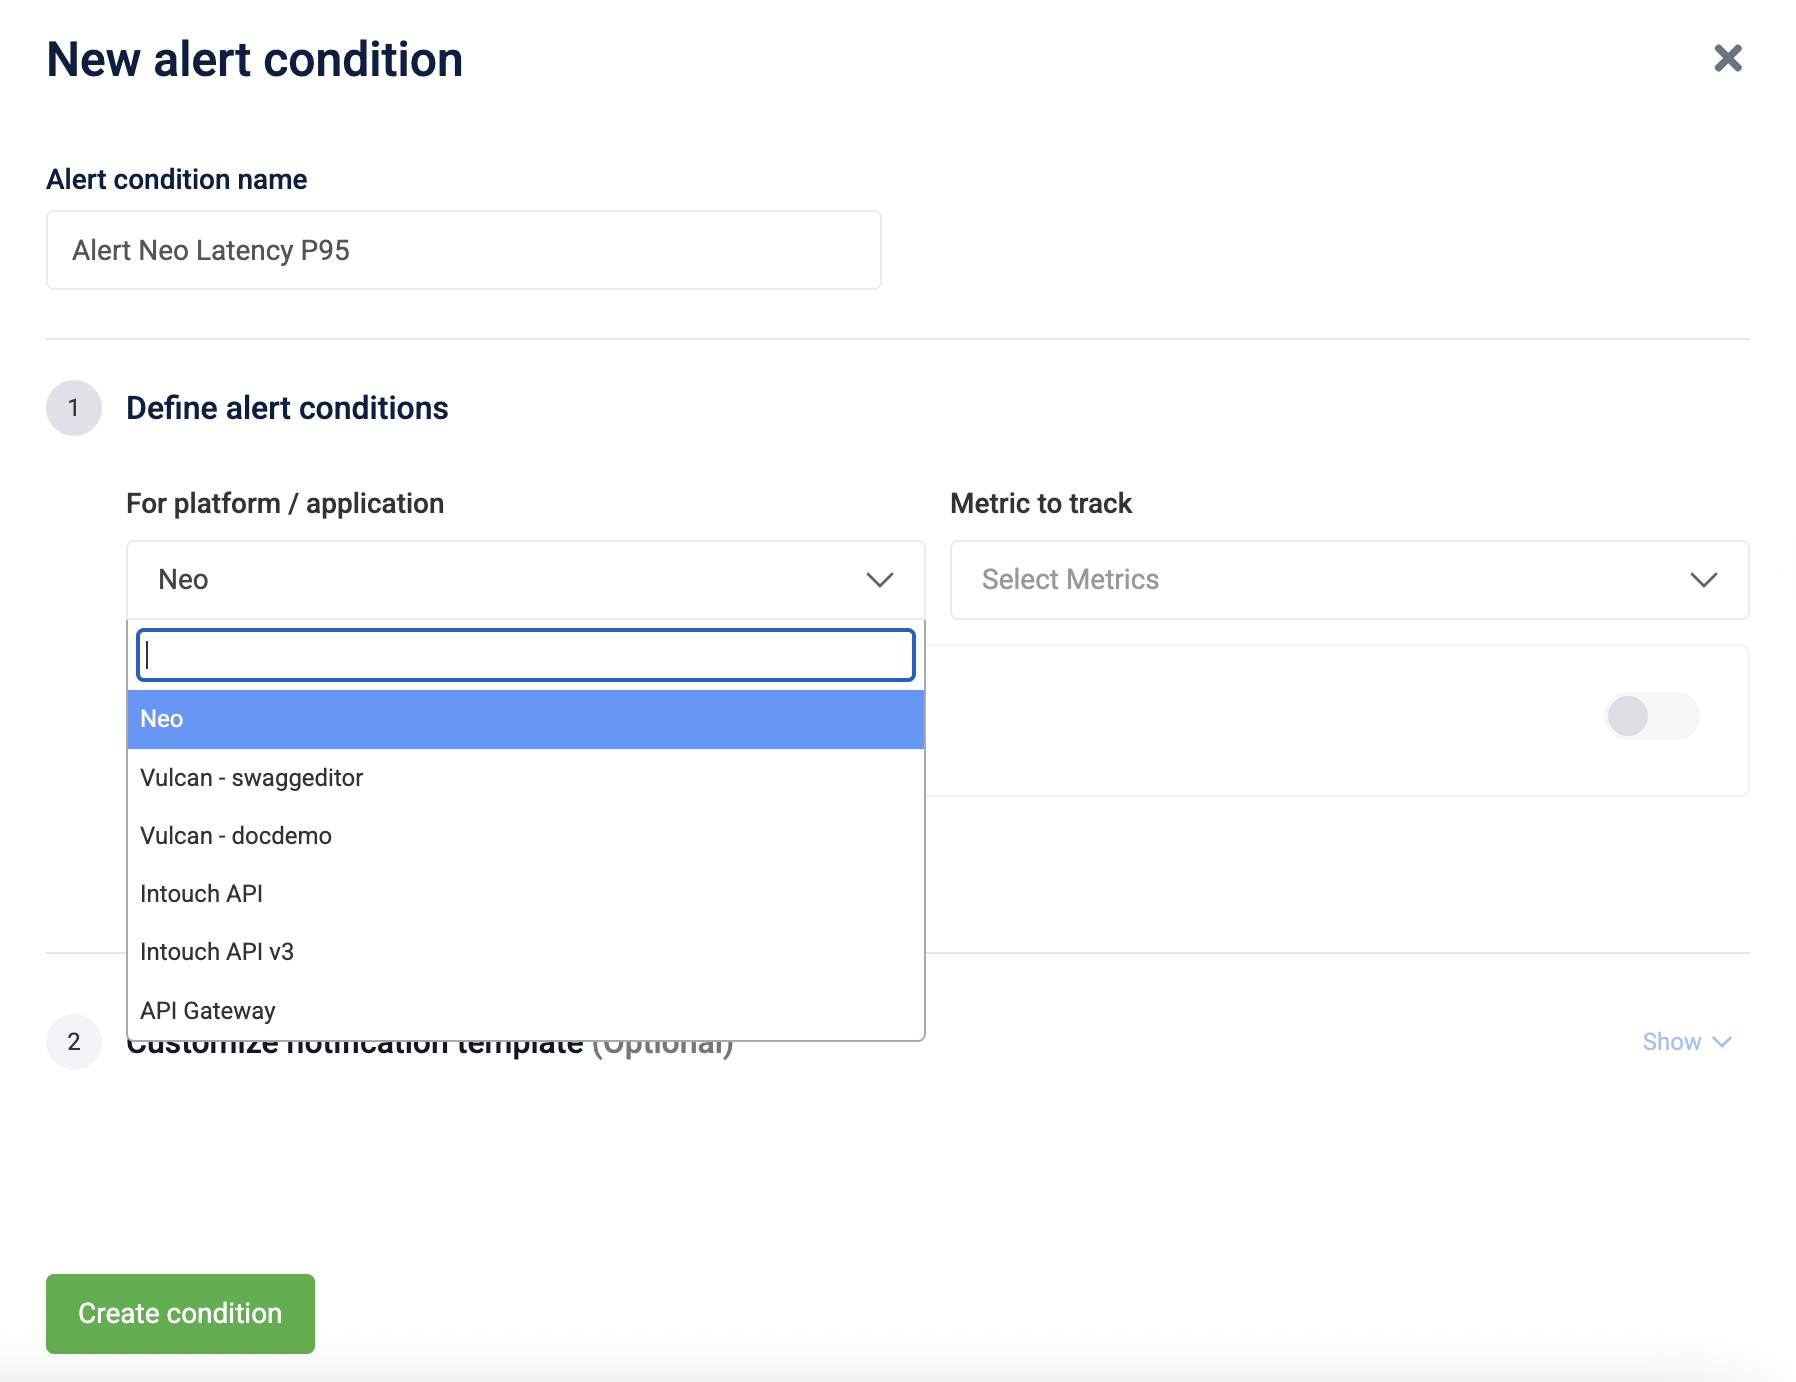
Enter an Alert Condition Name.
-
Define the alert scope and select specific APIs if required.
-
From the drop-down For platform/application, select the platform or application to monitor.
-
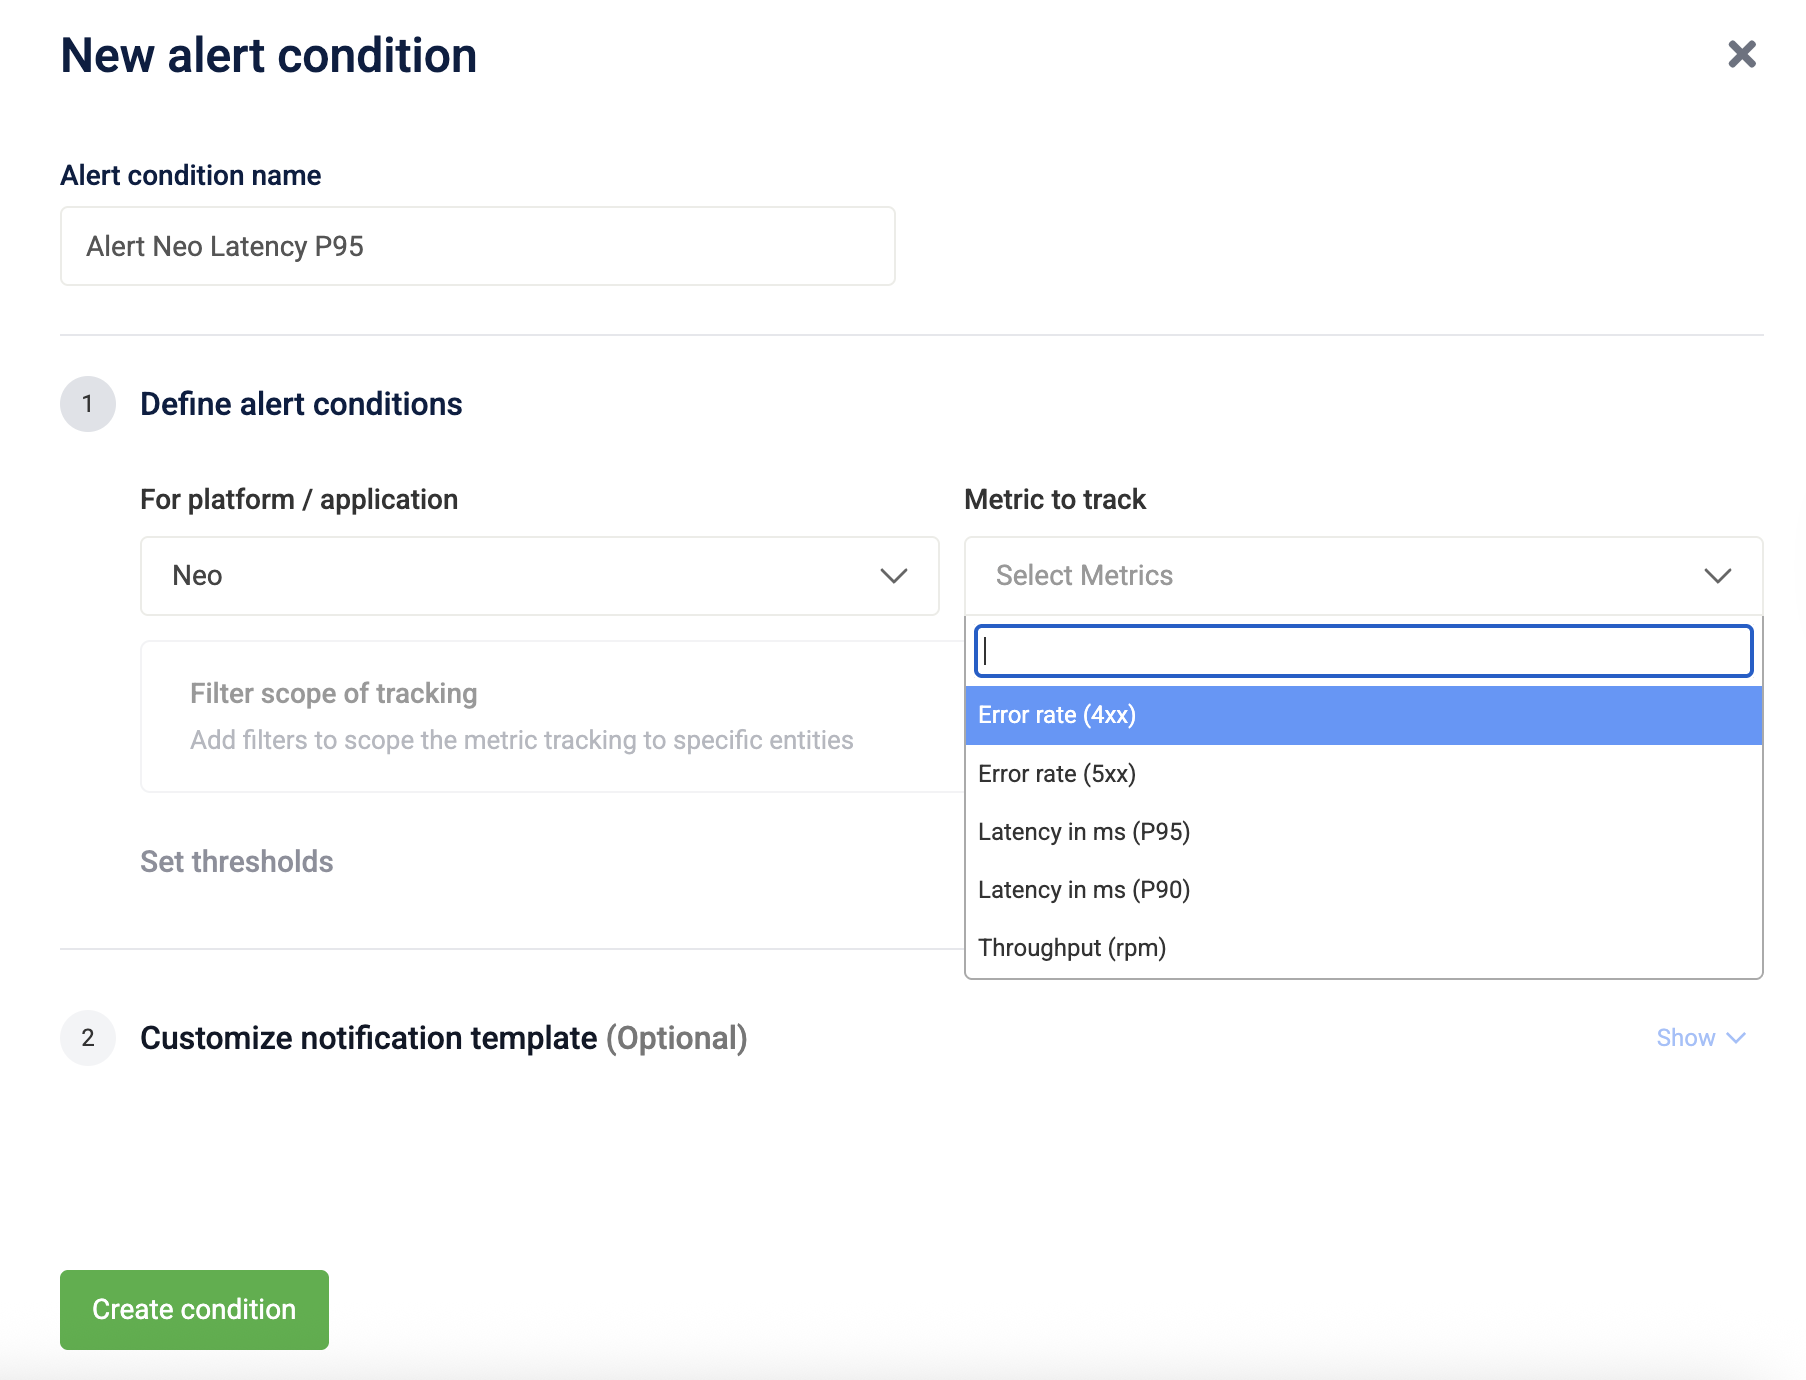
From the Metric to track drop-down, select the metric.
-
(Optional) To track specific APIs, turn on Filter scope of tracking and select APIs from the Filter by APIs drop-down.
Note 1: If Filter Scope of Tracking is disabled, the alert monitors all APIs in the selected platform or application. If enabled, the alert applies only to the selected APIs.
Note 2: The Filter by APIs list shows APIs used in the last 7 days. If an API is missing, send a request to it so it registers usage. The API appears after the list refreshes.
-
-
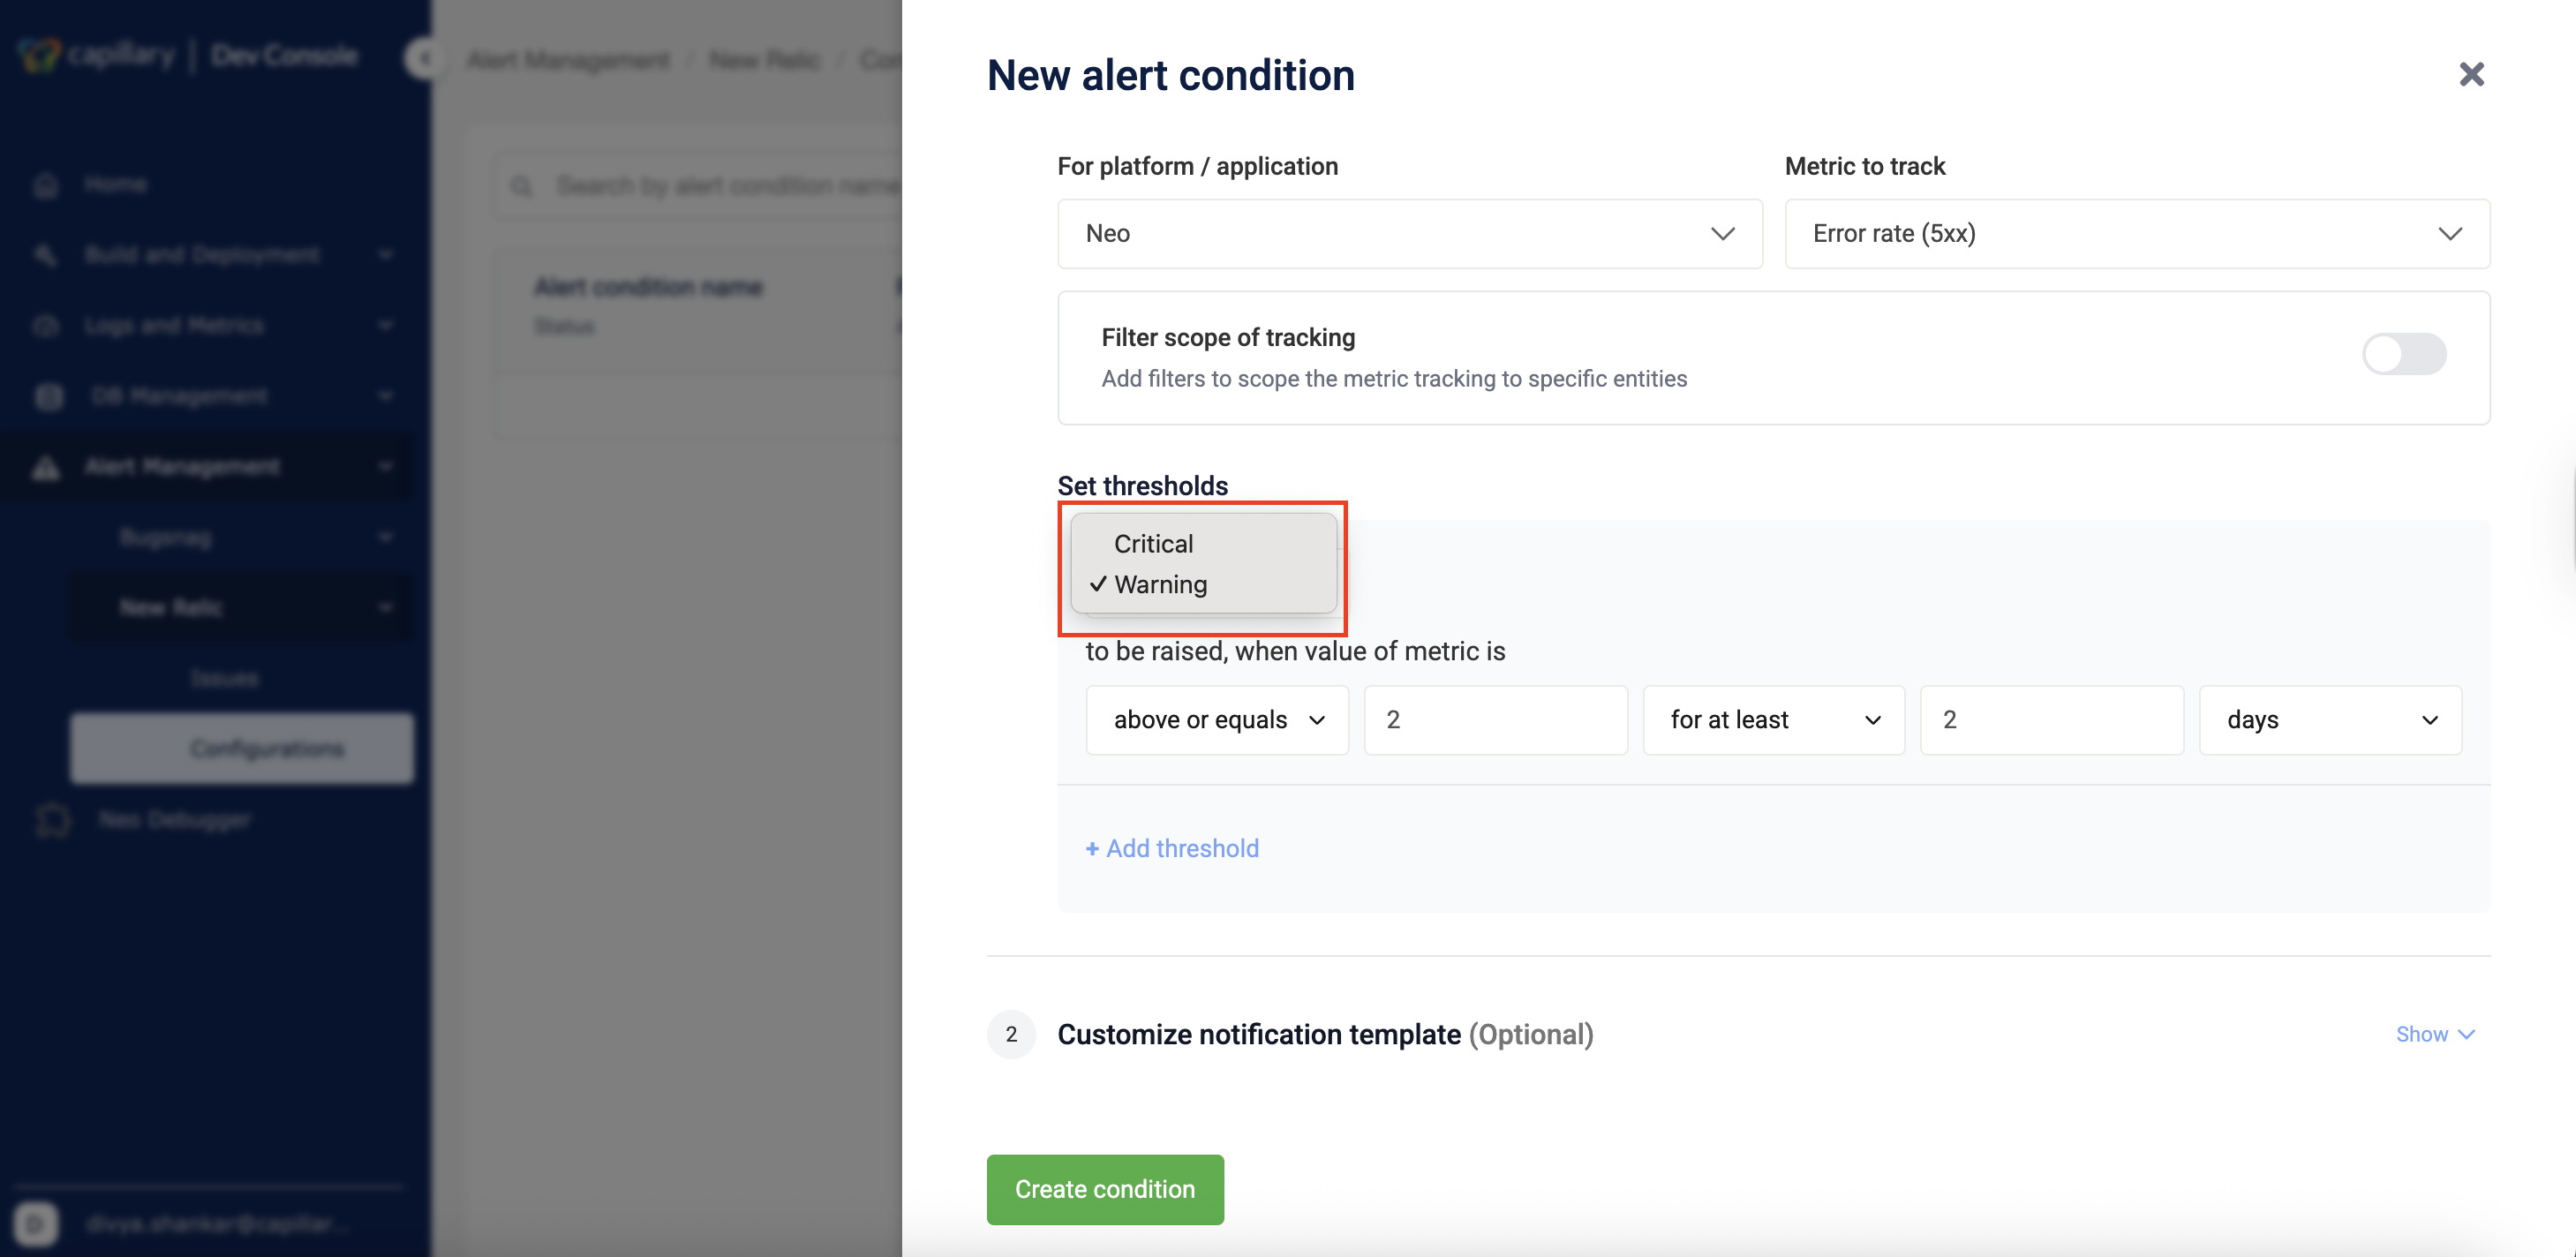
Set threshold
-
Select the priority as Warning or Critical from the drop-down.
-
Select the condition.
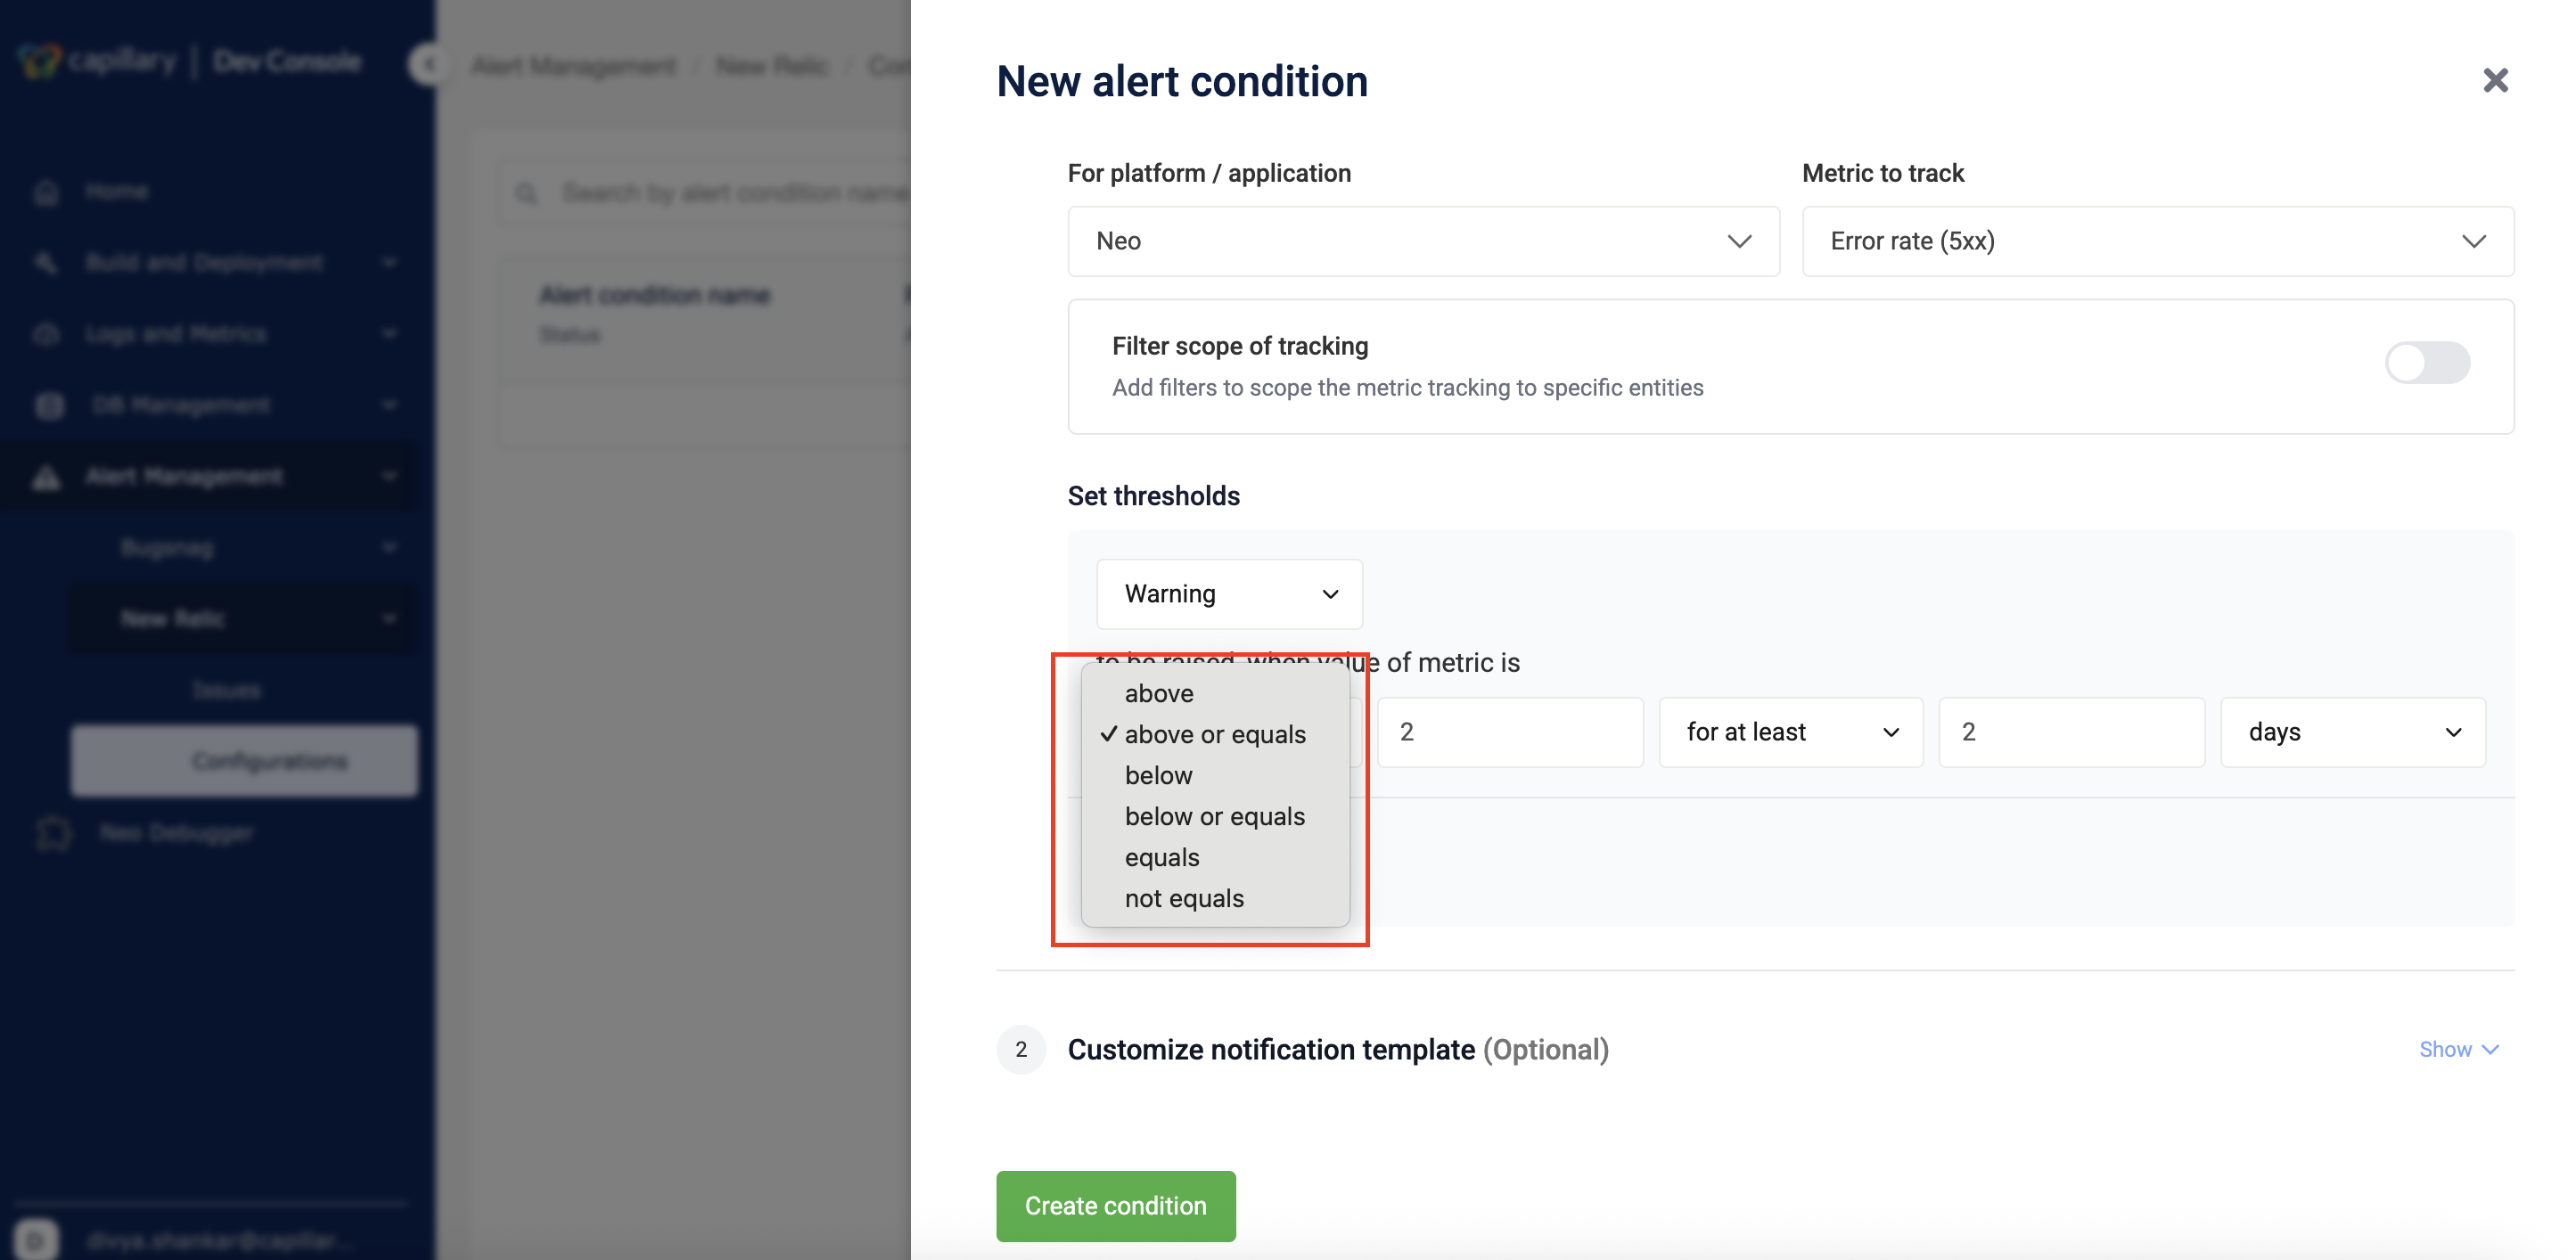
-
Enter the threshold value.
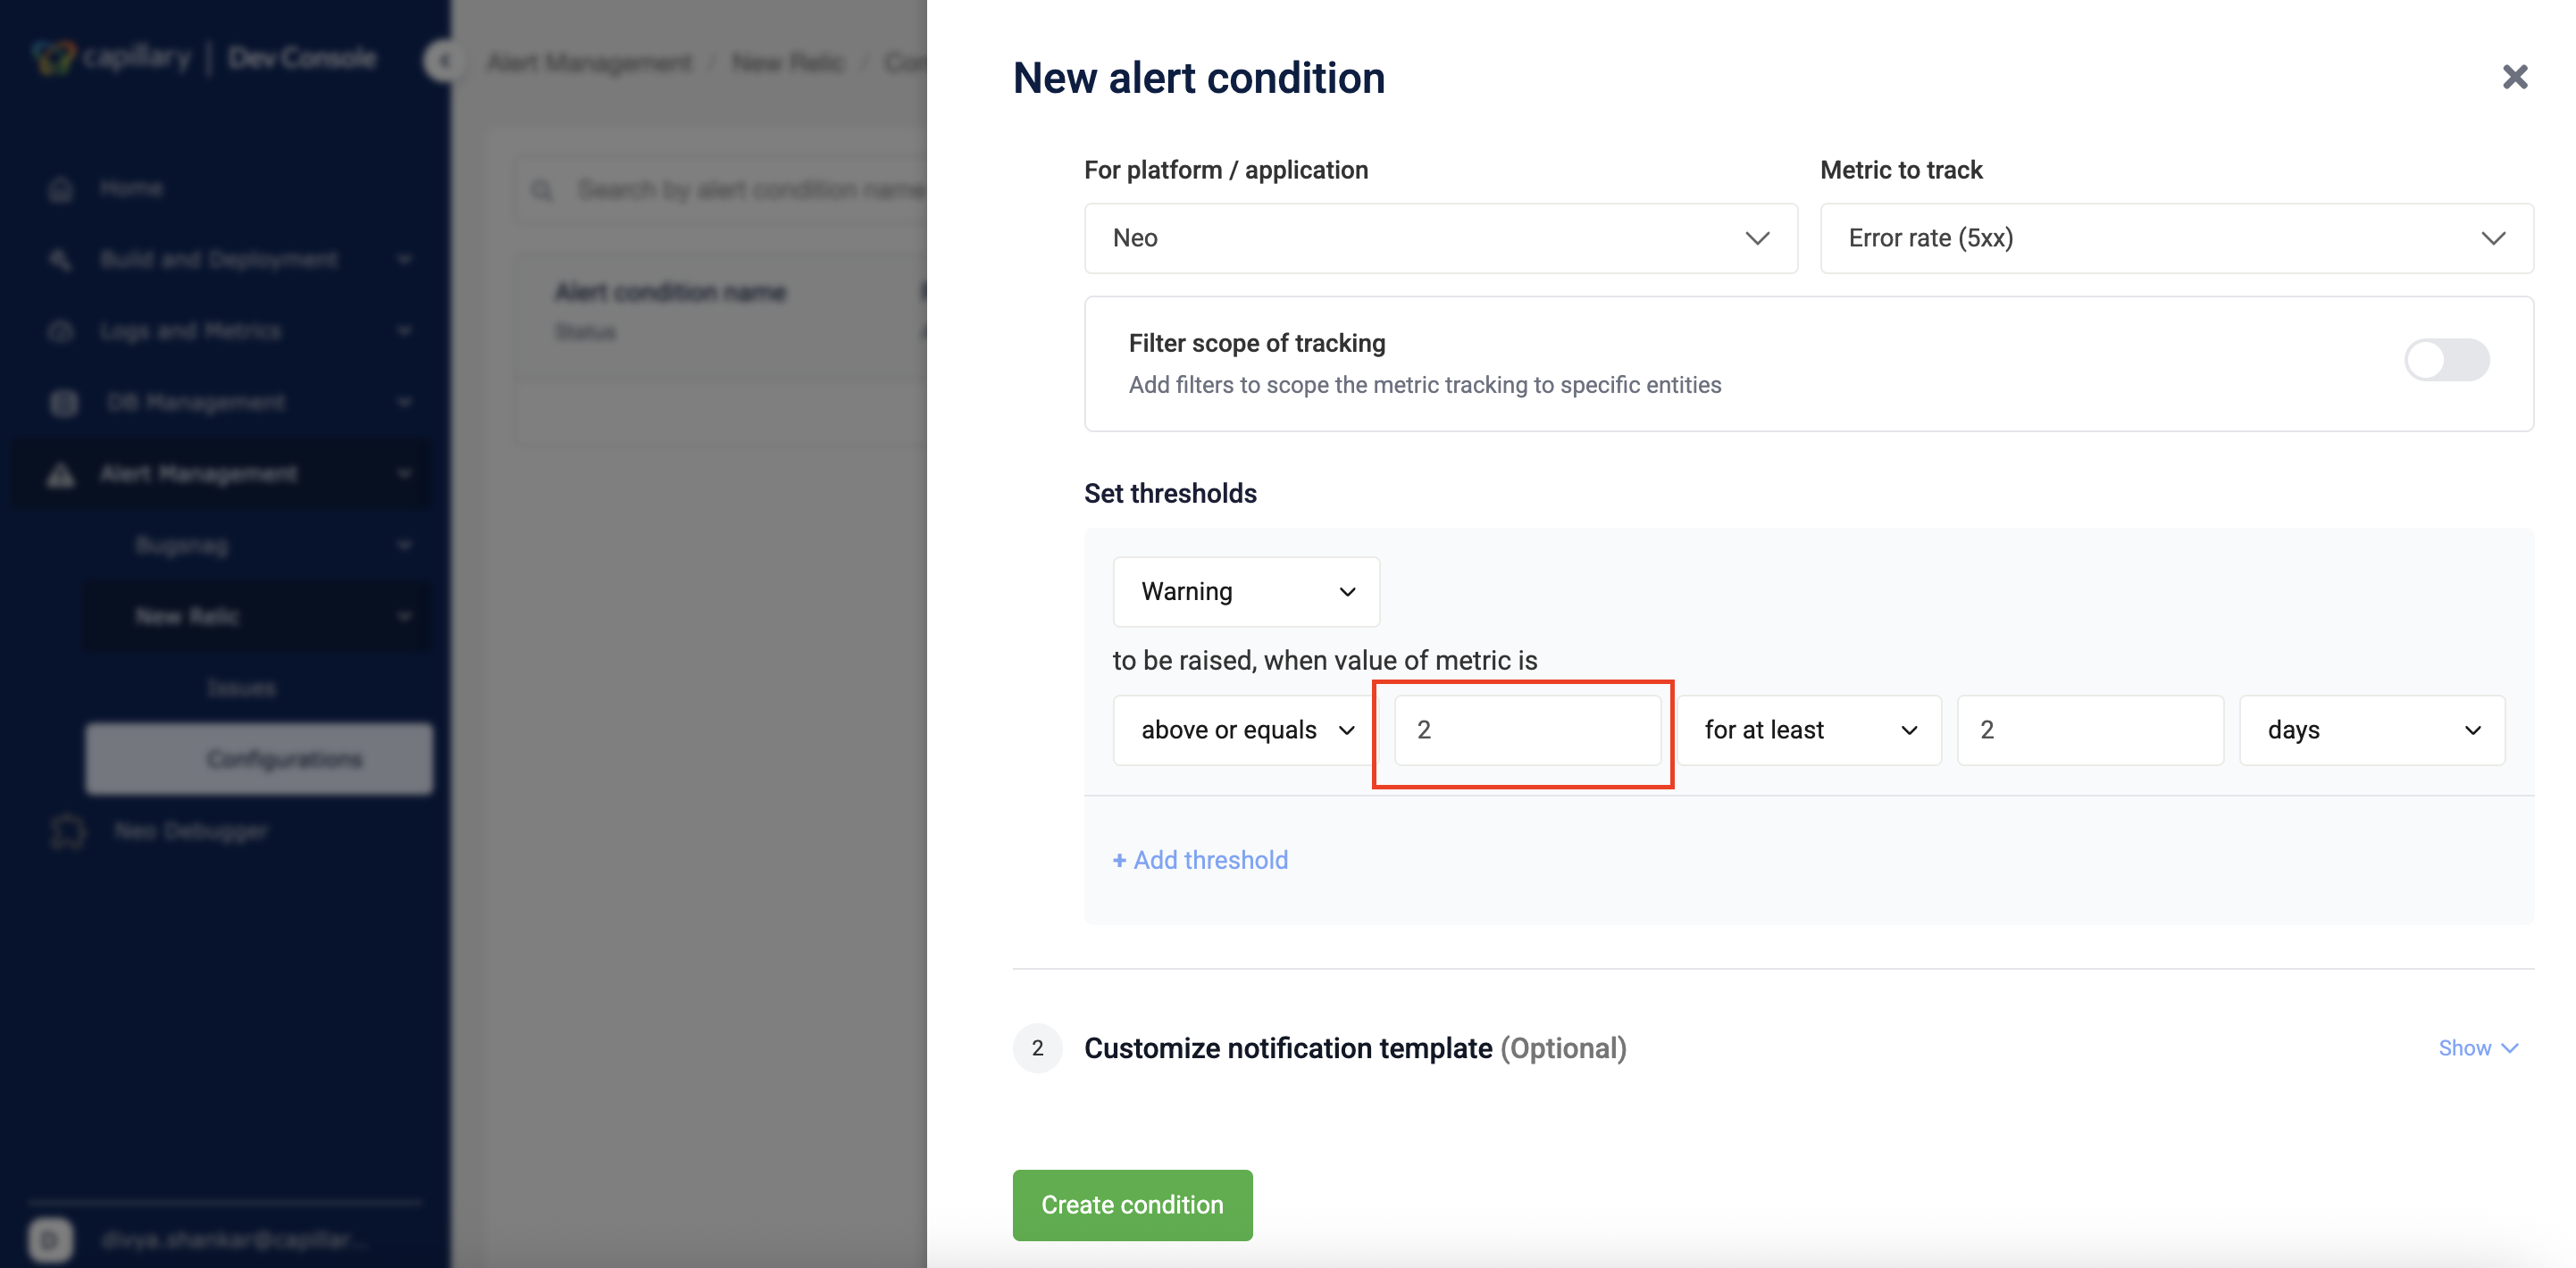
-
Select the duration type from the drop-down.
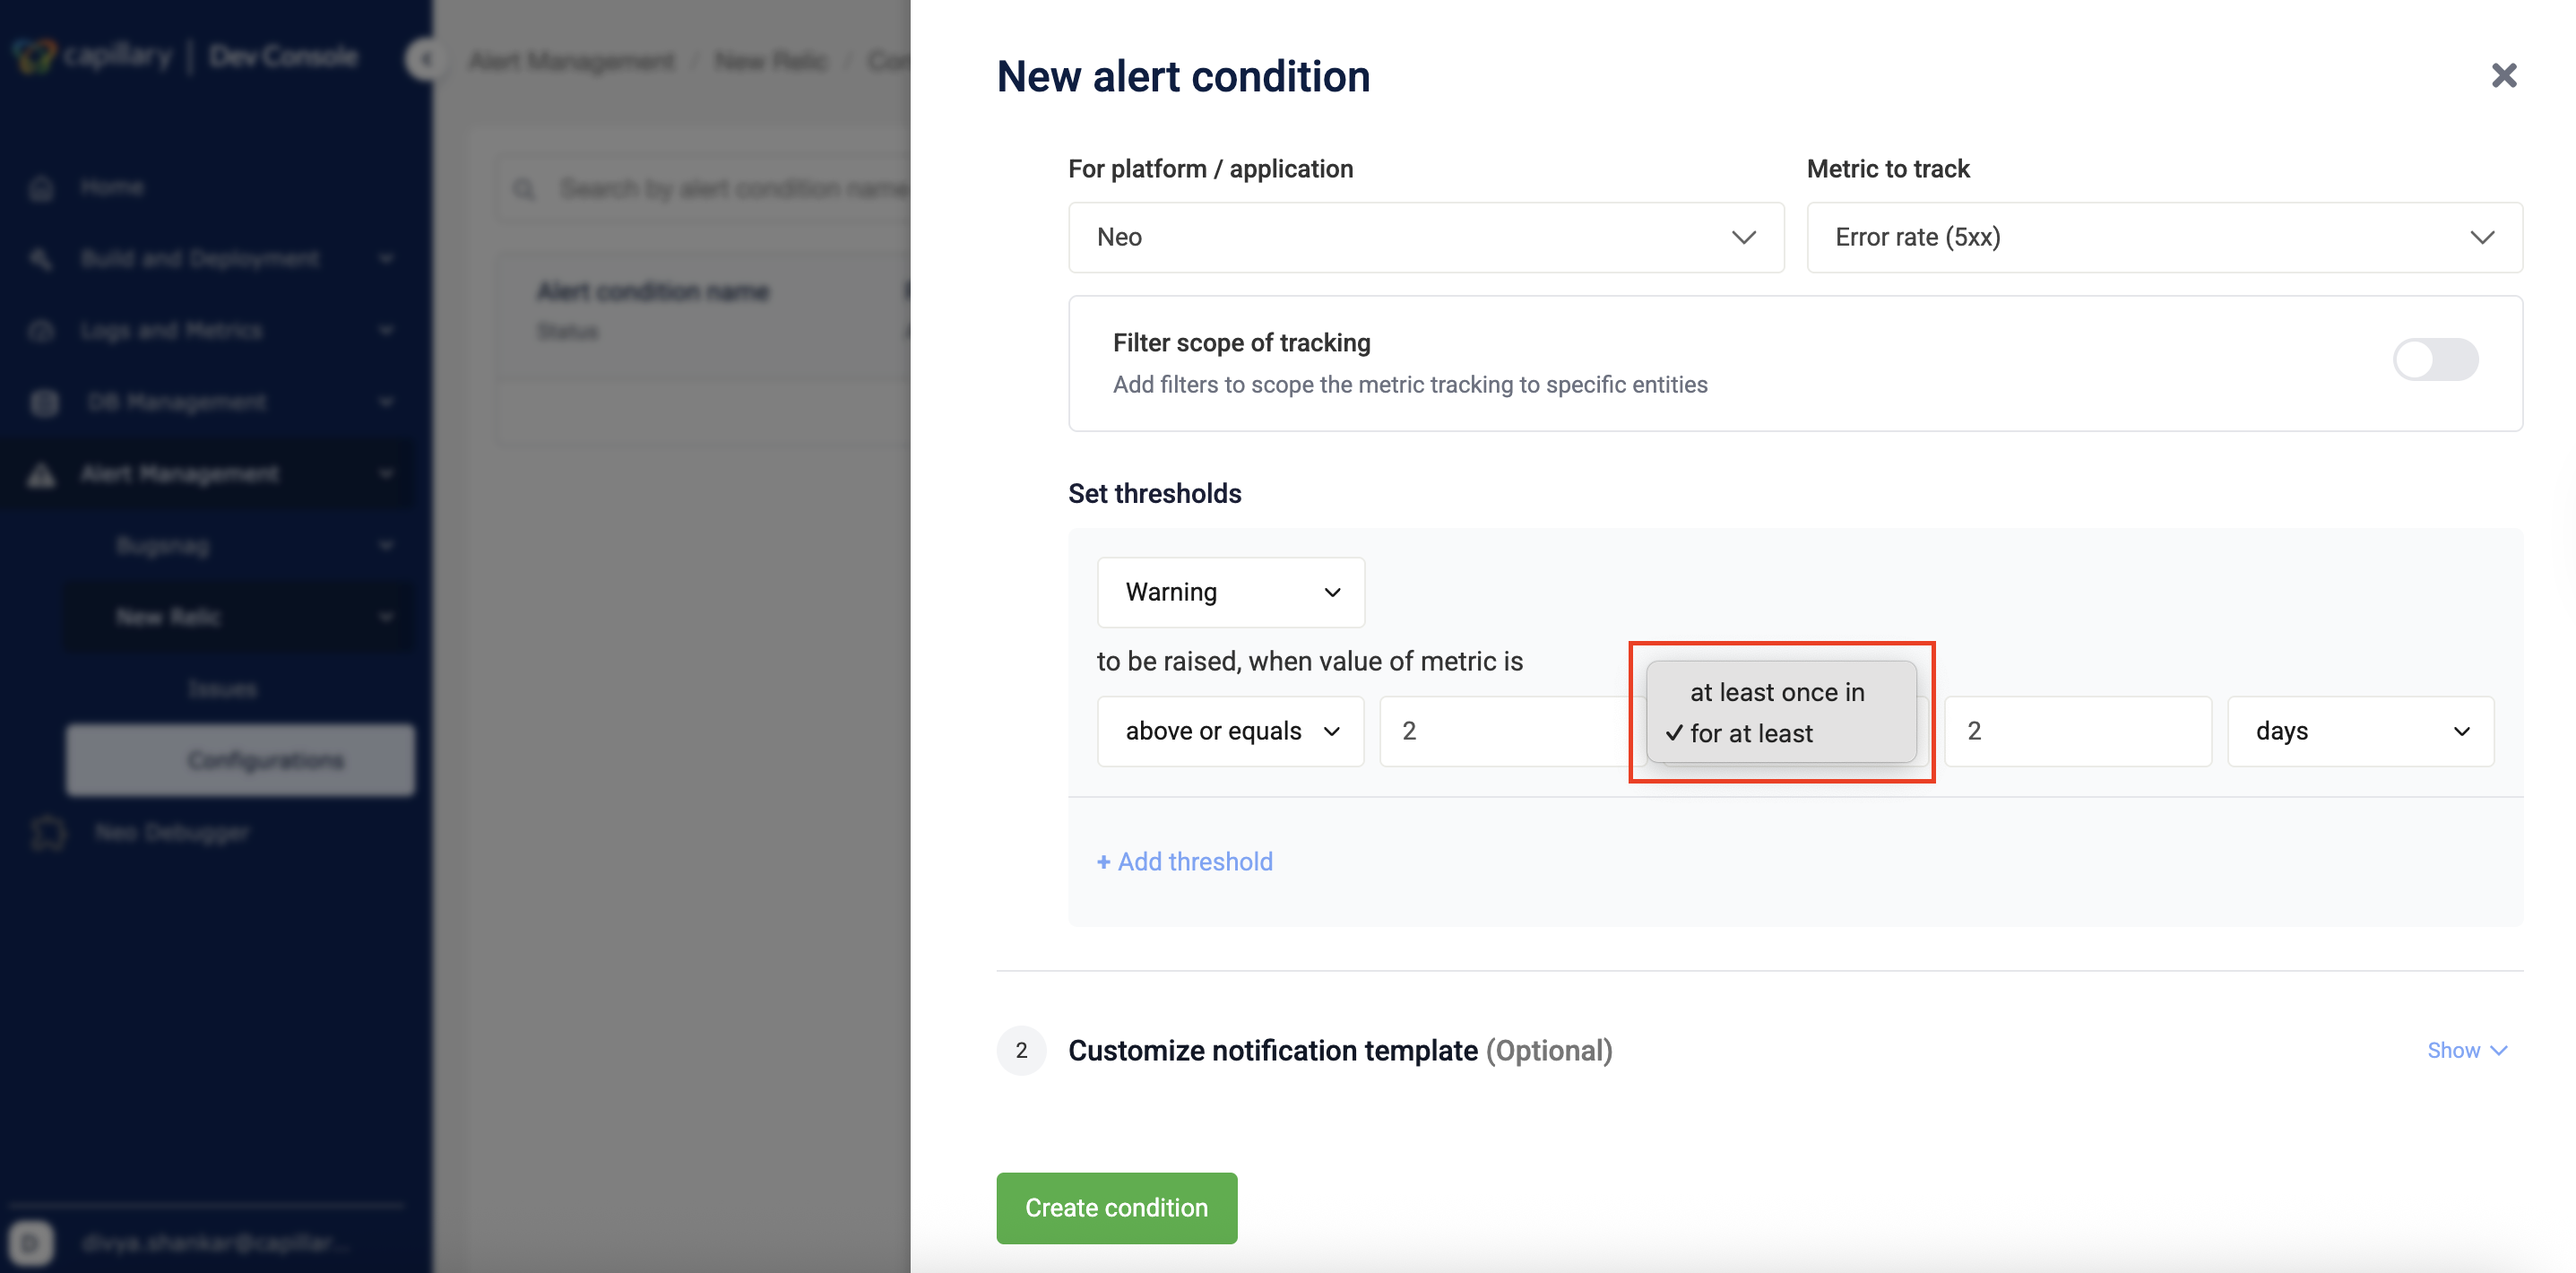
-
Enter the duration value using the up-down controls.
-
Select the time unit from the drop-down.
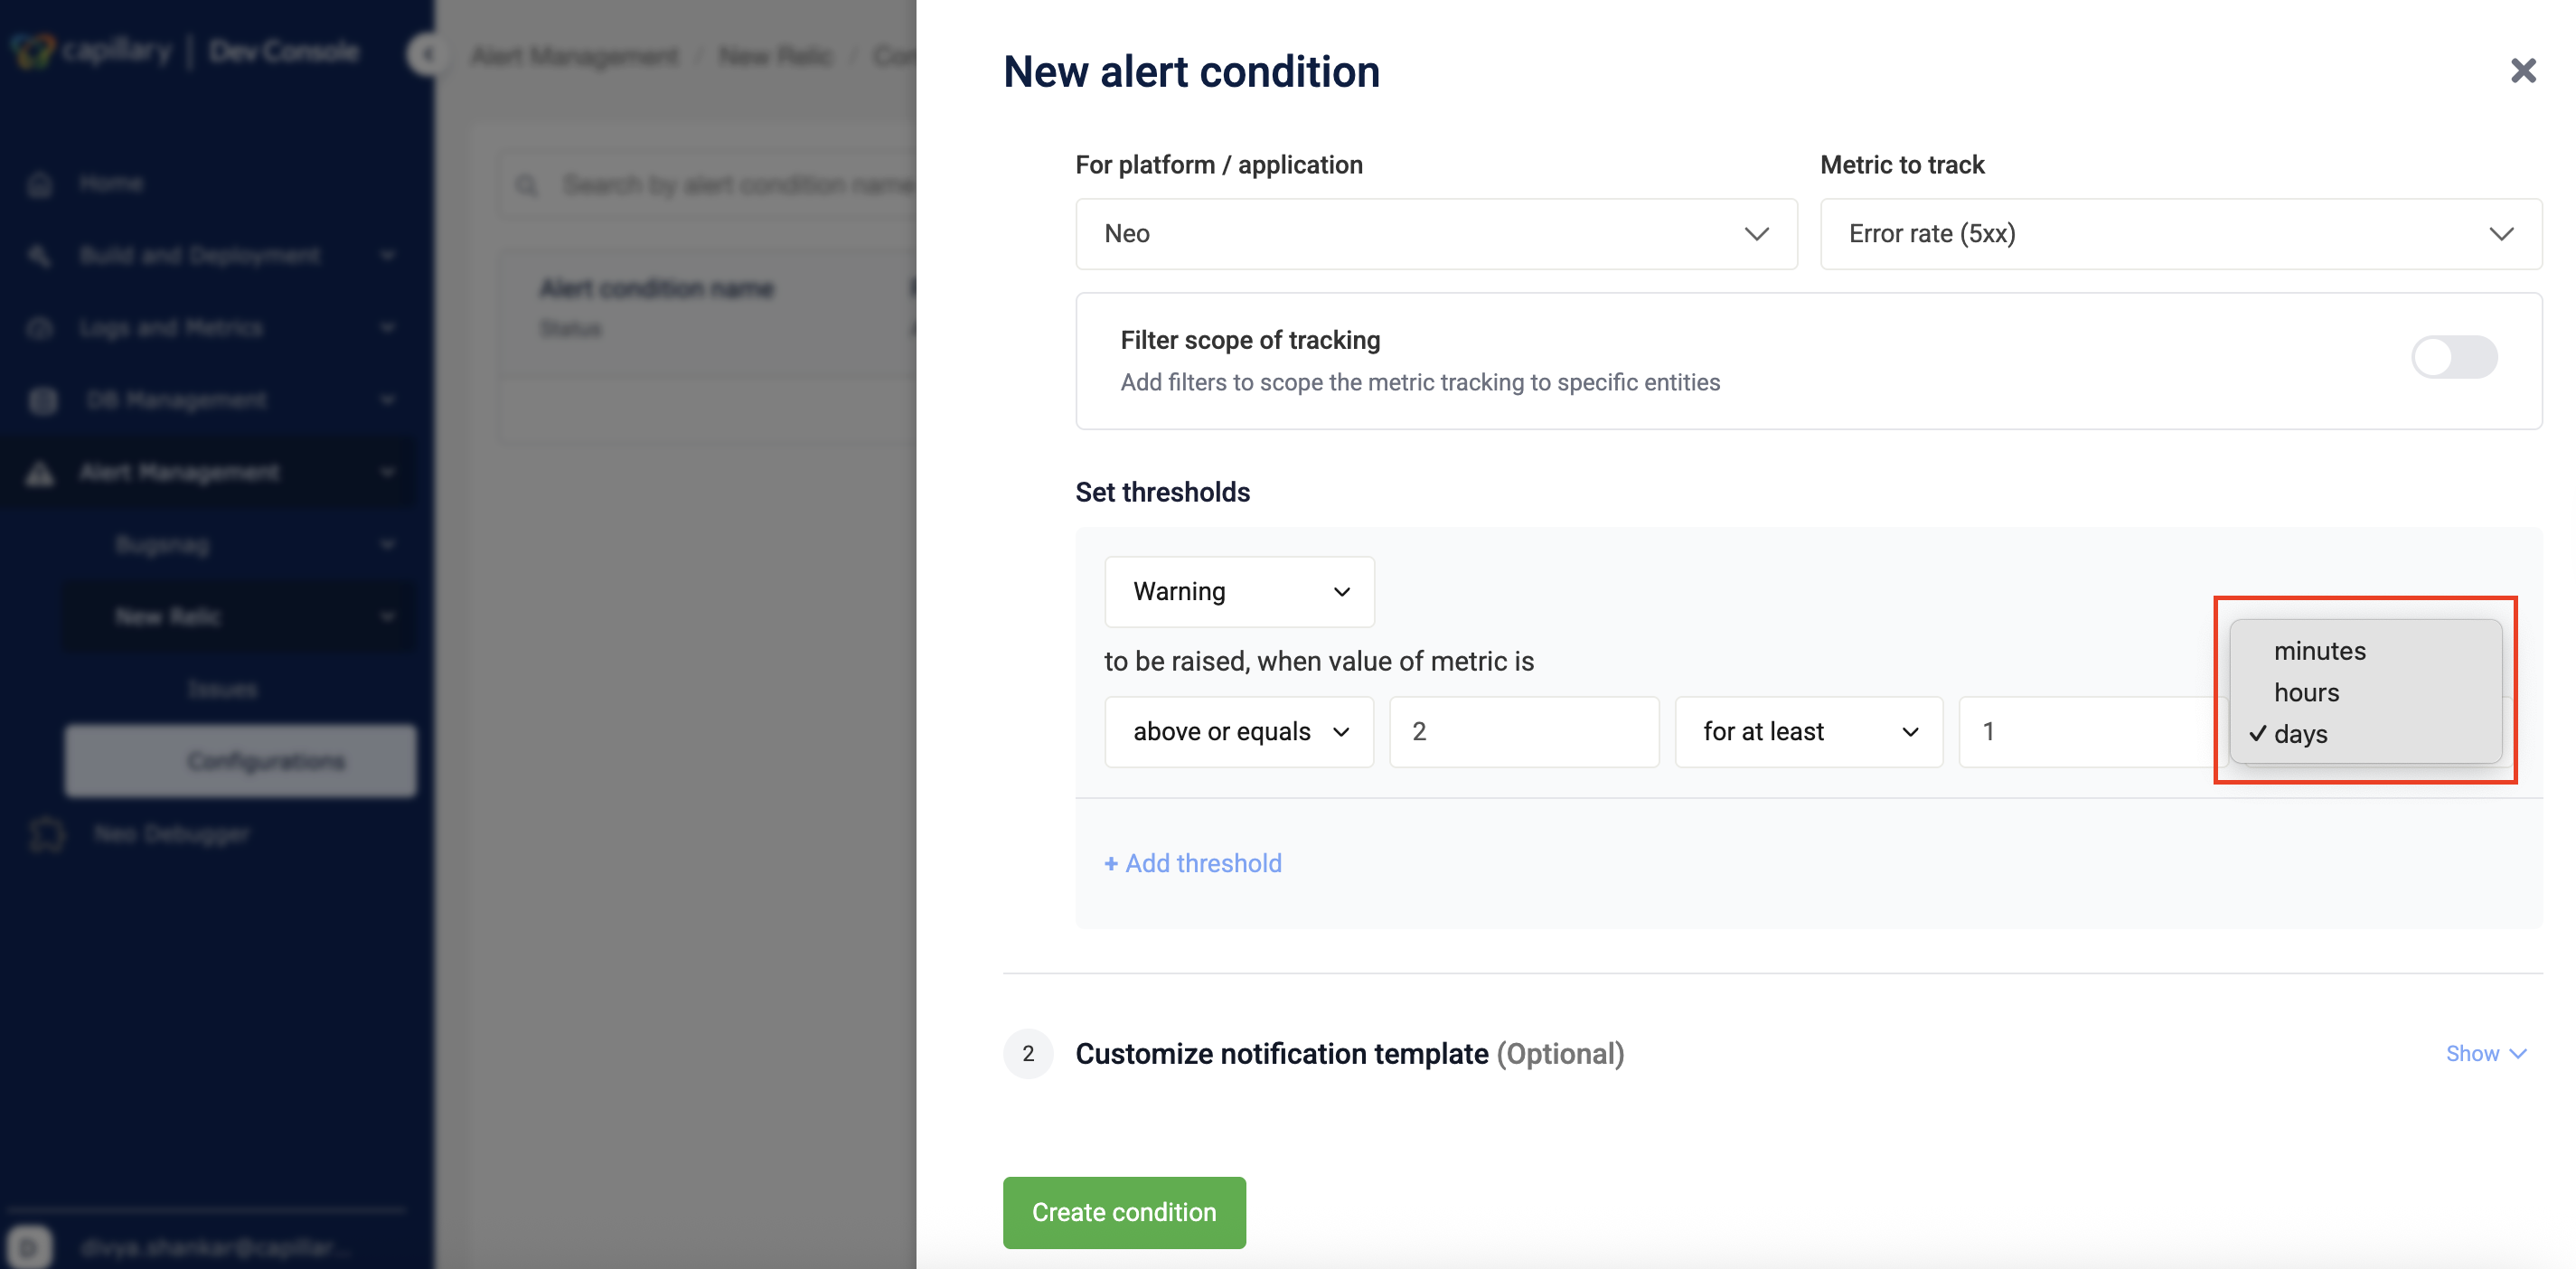
-
(Optional) Click + Add threshold to add another threshold.
Note: Each alert condition supports a maximum of two thresholds: one Warning and one Critical.
-
-
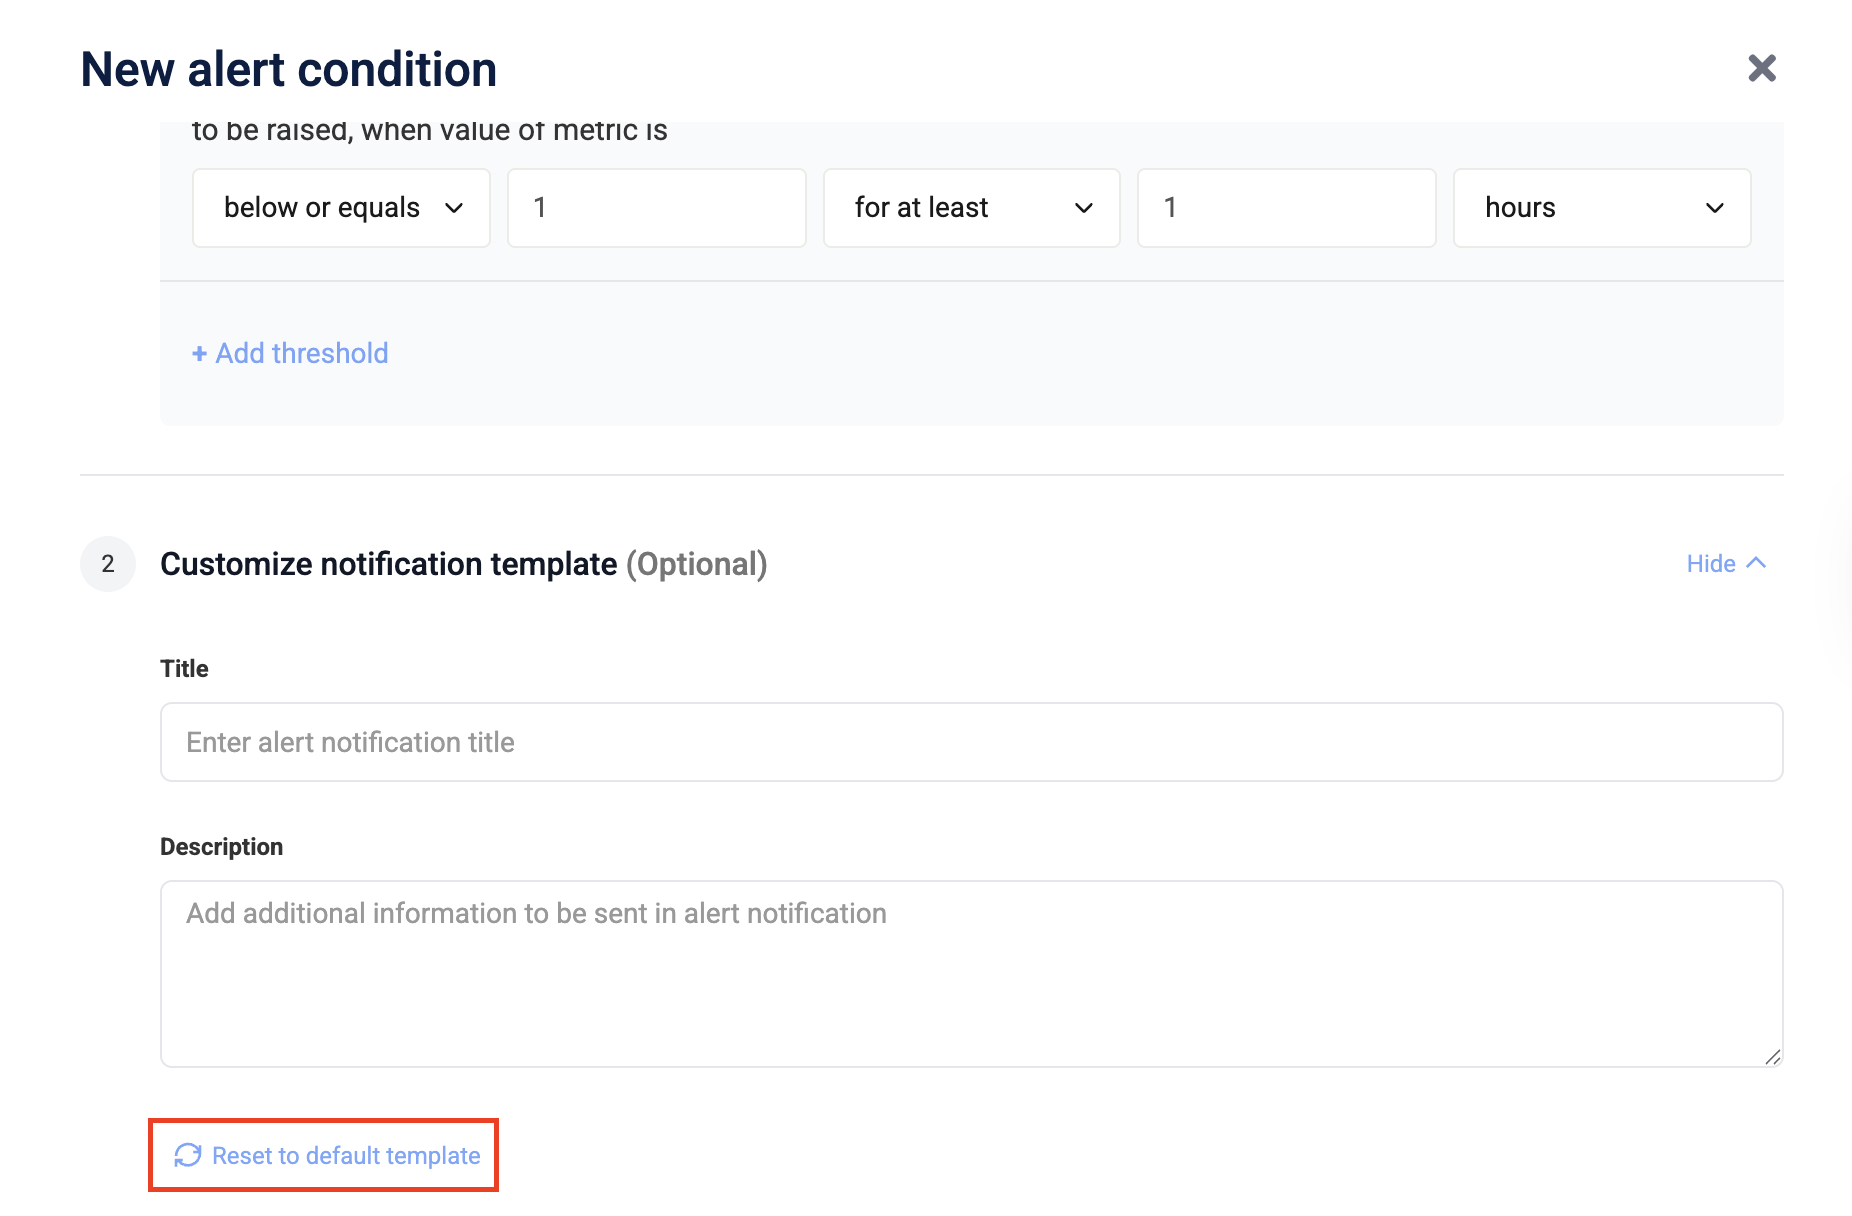
(Optional) Customize notification template
-
Enter the notification title in the Title field.
-
Enter additional details in the Description field.
-
(Optional) Click Reset to default template to restore the default message.
-
-
Save and create the condition by clicking Create condition.
After you create the condition, you can review and manage it from the alert listing page.
Manage alert conditions
After creation, you can view, edit, disable, or delete an alert condition.
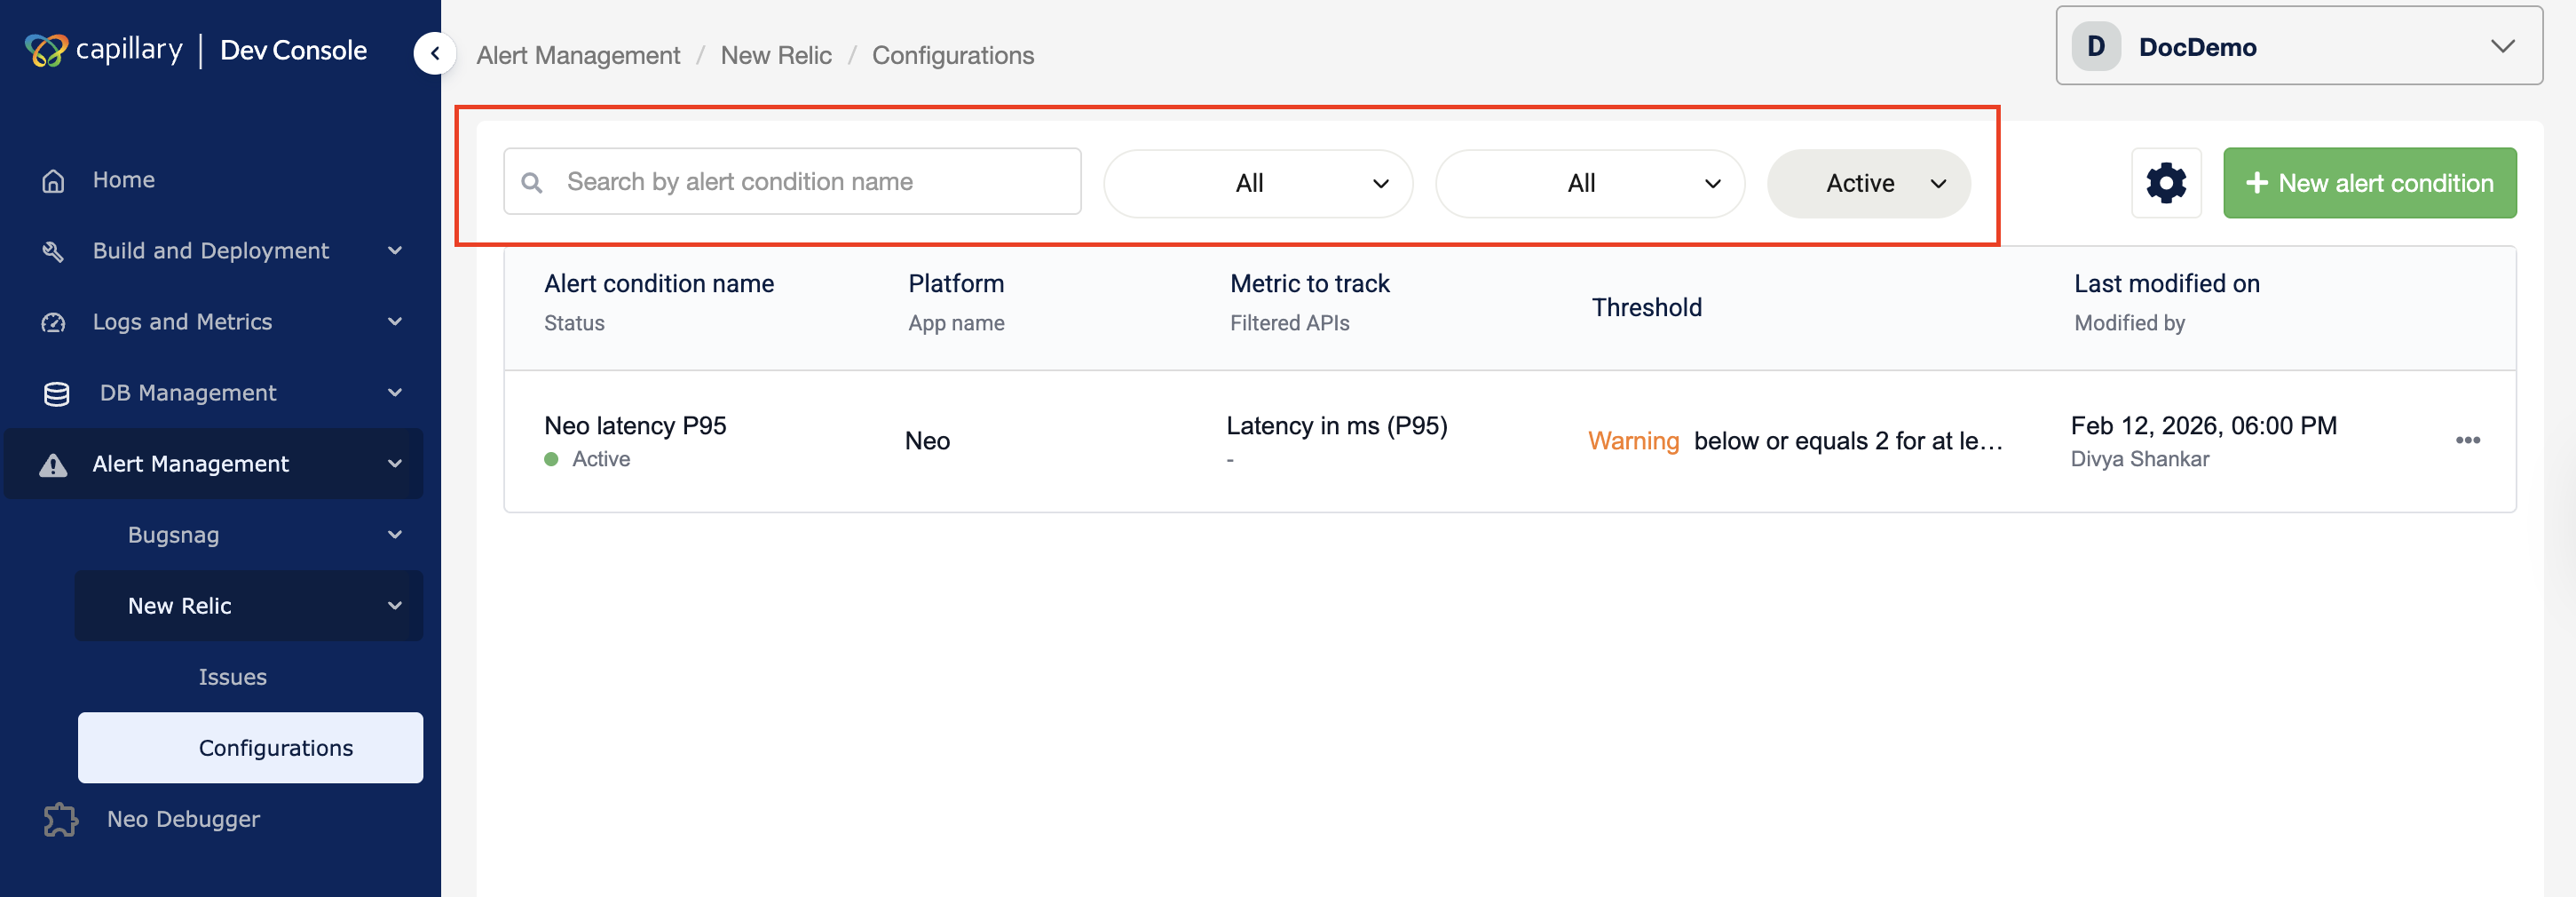
View alert condition
The listing page displays all configured alert conditions for the selected organization. You can open an alert condition to review its configuration, status, and thresholds. You can also filter the list to quickly find specific alerts.
Filter Alerts
- Navigate to Alert Management → New Relic → Configuration in Dev Console.
- Use the time filter to select the alert time range.
- Use the status filter to view Active, Acknowledged, or Closed alerts.
- Use the priority filter to filter by severity.
- Use the platform filter to view alerts for a specific platform.
- Enter an alert name in the search bar.
The alert list updates based on the selected filters.
After reviewing an alert condition, you can edit it to update thresholds or notification settings.
Edit alert condition
Editing an alert condition lets you adjust its behavior without recreating it. You can modify thresholds and notification details while keeping the alert active. You cannot change the selected platform/application or the metric being tracked after an alert condition is created. To change these fields, create a new alert condition.
To edit, follow the steps.
- Navigate to Alert Management → New Relic → Configuration in the Dev Console.
- Locate the alert condition in the listing page.
- Click the alert condition to open it.
- Click Edit.
- Modify the allowed fields.
- Click Save.
If an alert condition is no longer needed, you can disable it from the listing page.
Disable an alert
You can disable an alert if you no longer need it. To disable an alert, follow the steps below:
- Navigate to Alert Management → New Relic → Configuration in the Dev Console.
- Locate the alert condition in the listing page.
- Click the ⋯ (action menu) next to the alert.
- Click Disable alert.
A message appears confirming that the alert was disabled successfully.
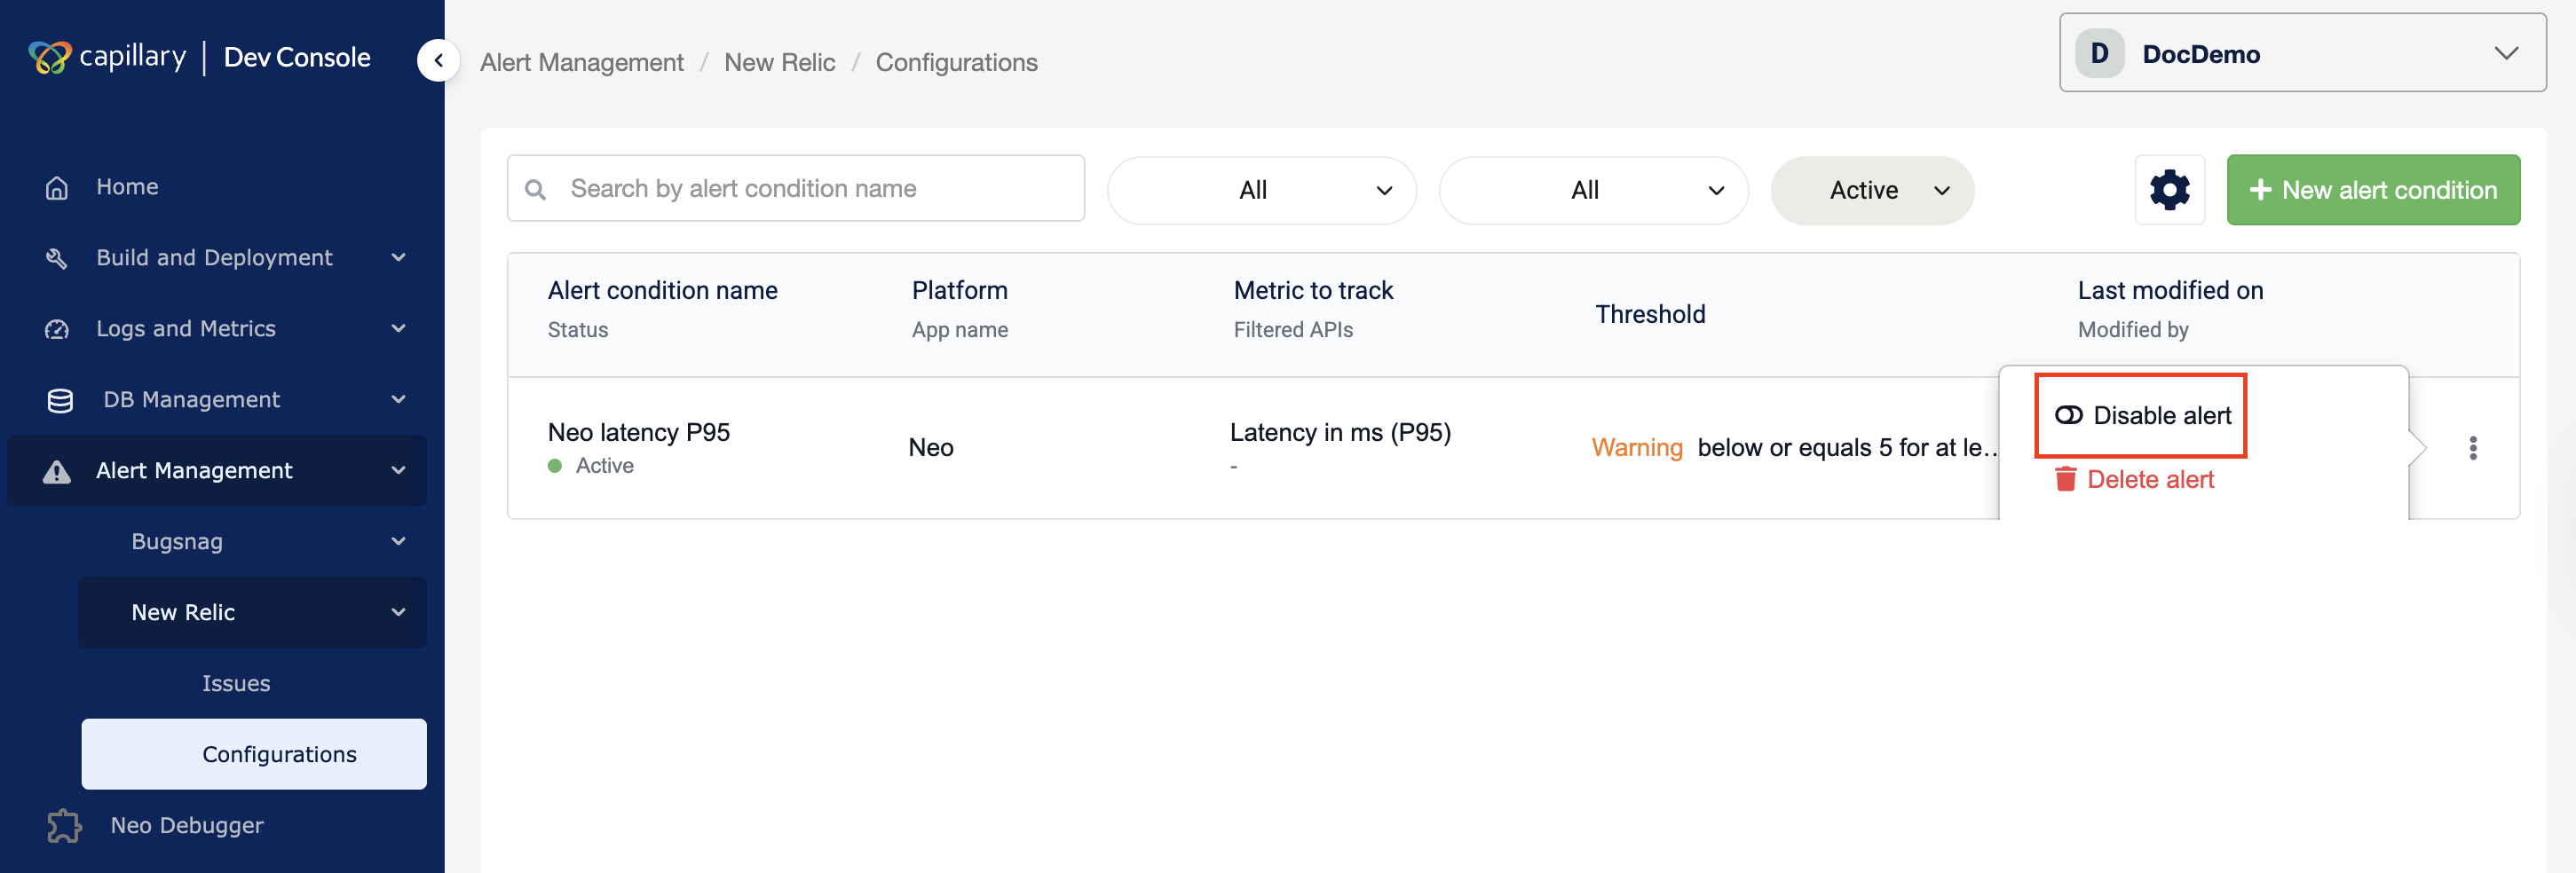
The alert stops triggering, but remains saved and can be enabled at any time.
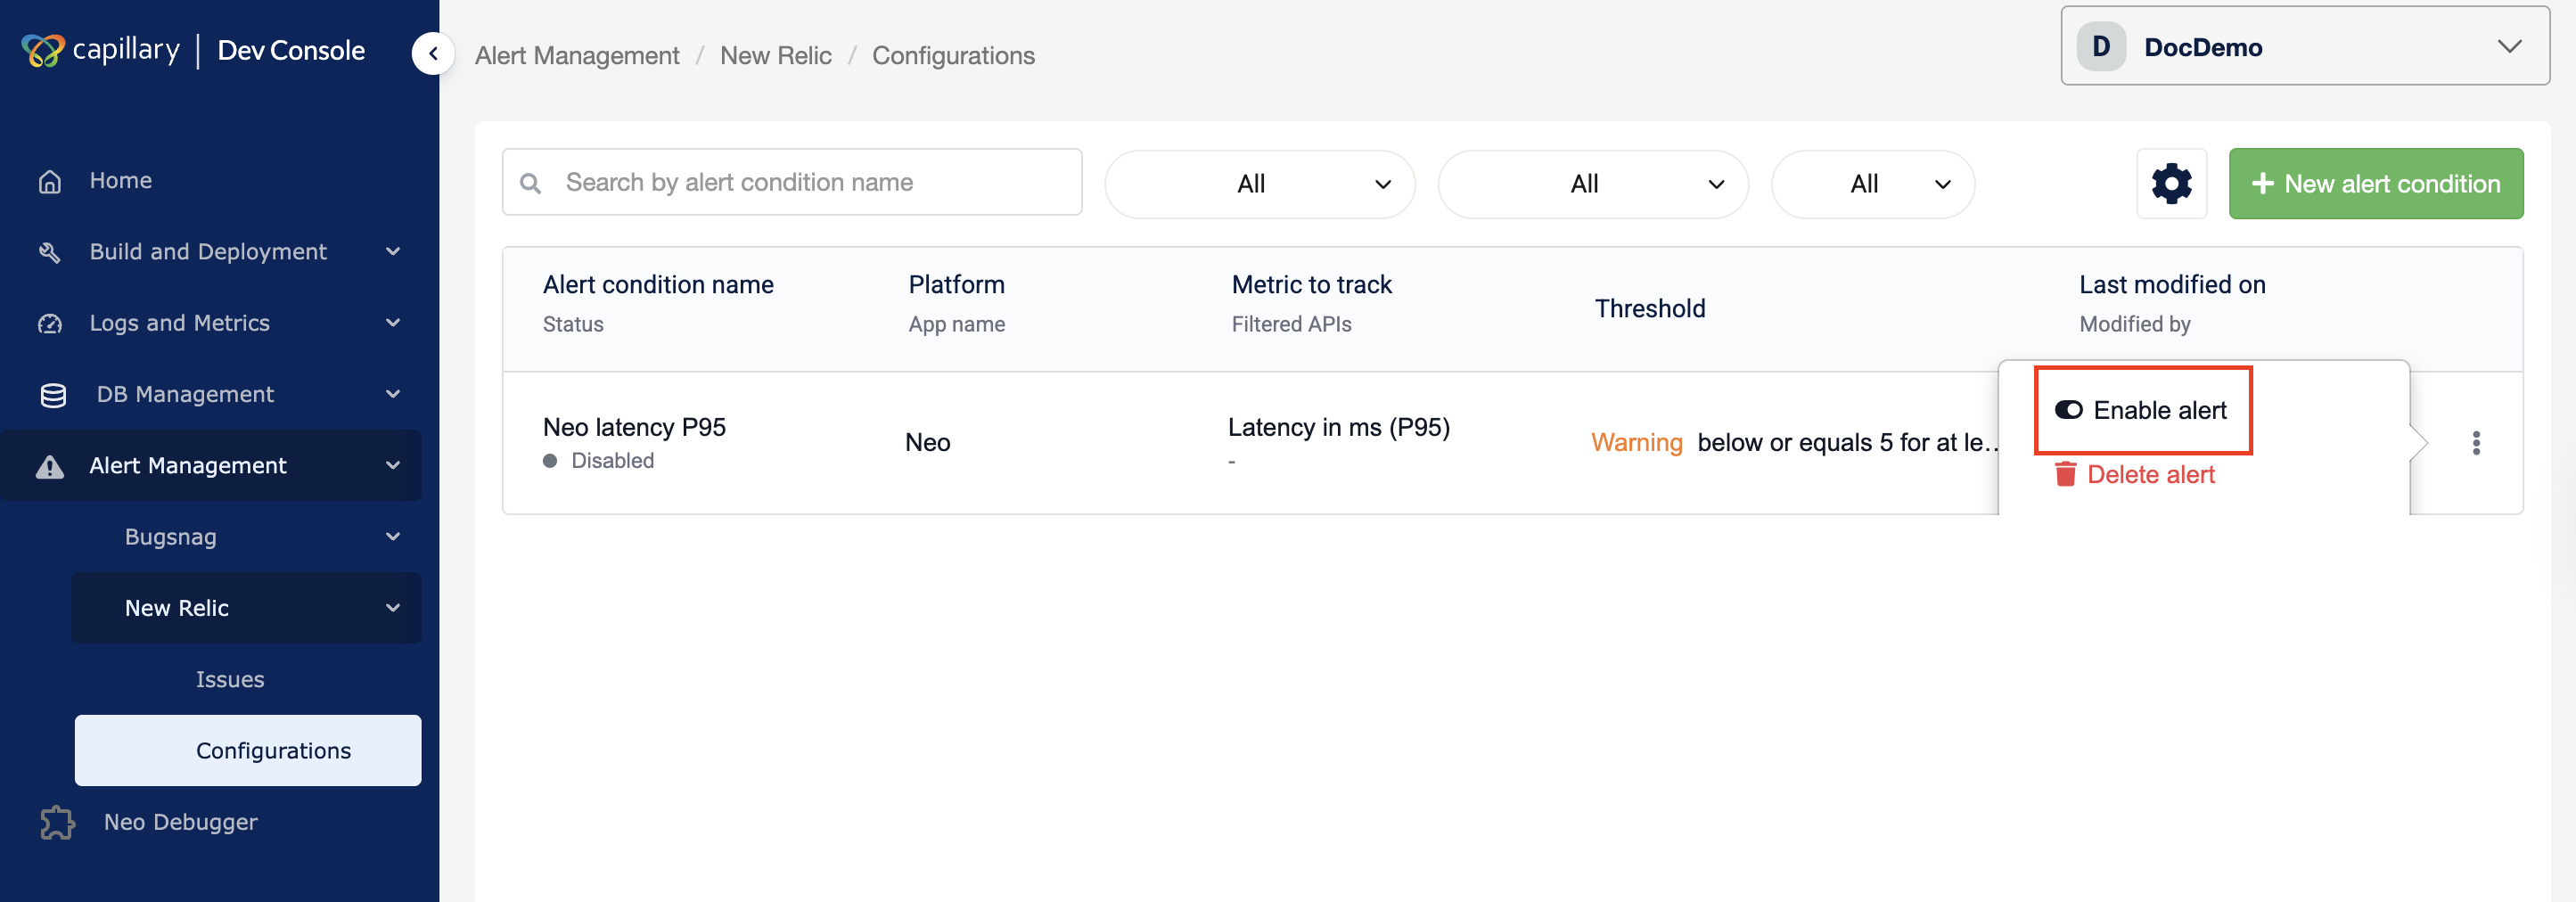
Enable an alert
You can enable an alert condition to restore it to active monitoring so it can trigger notifications again. To enable an alert, follow the steps below:
- Navigate to Alert Management → New Relic → Configuration in the Dev Console.
- Locate the alert condition in the listing page.
- Click the ⋯ (action menu) next to the alert.
- Click Enable alert.
A message appears confirming that the alert was enabled successfully.
You can delete an alert condition when it is no longer required for monitoring.
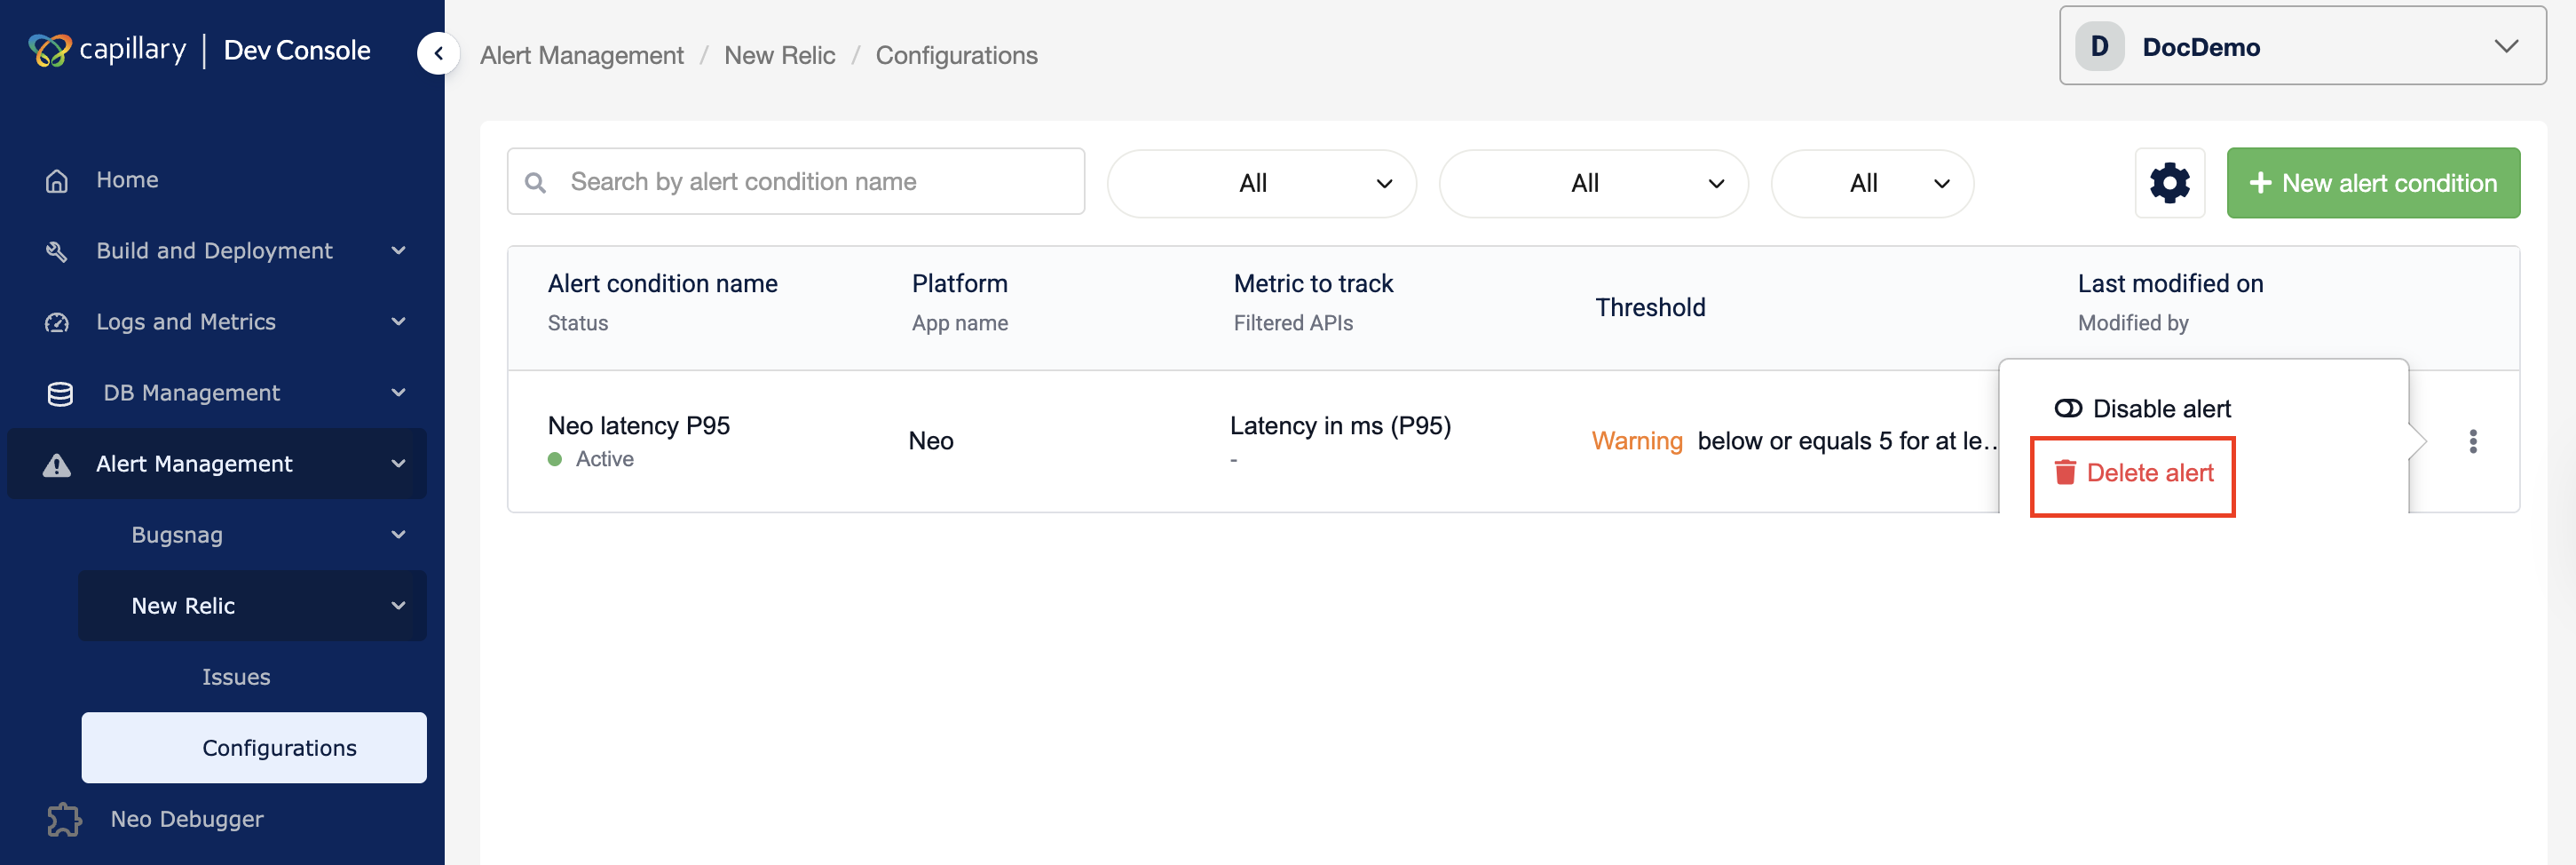
Delete an alert
You can delete an alert condition when it is no longer required for monitoring. Once deleted, it is permanently removed and cannot be restored; you must recreate it if needed.
To delete an alert, follow the steps below:
- Navigate to Alert Management → New Relic → Configuration in the Dev Console.
- Locate the alert condition in the listing page.
- Click the ⋯ (action menu) next to the alert.
- Click Delete.
A confirmation modal appears. - Click Delete condition.
A message appears confirming that the alert was deleted successfully, and it no longer appears in the listing page.
Issues
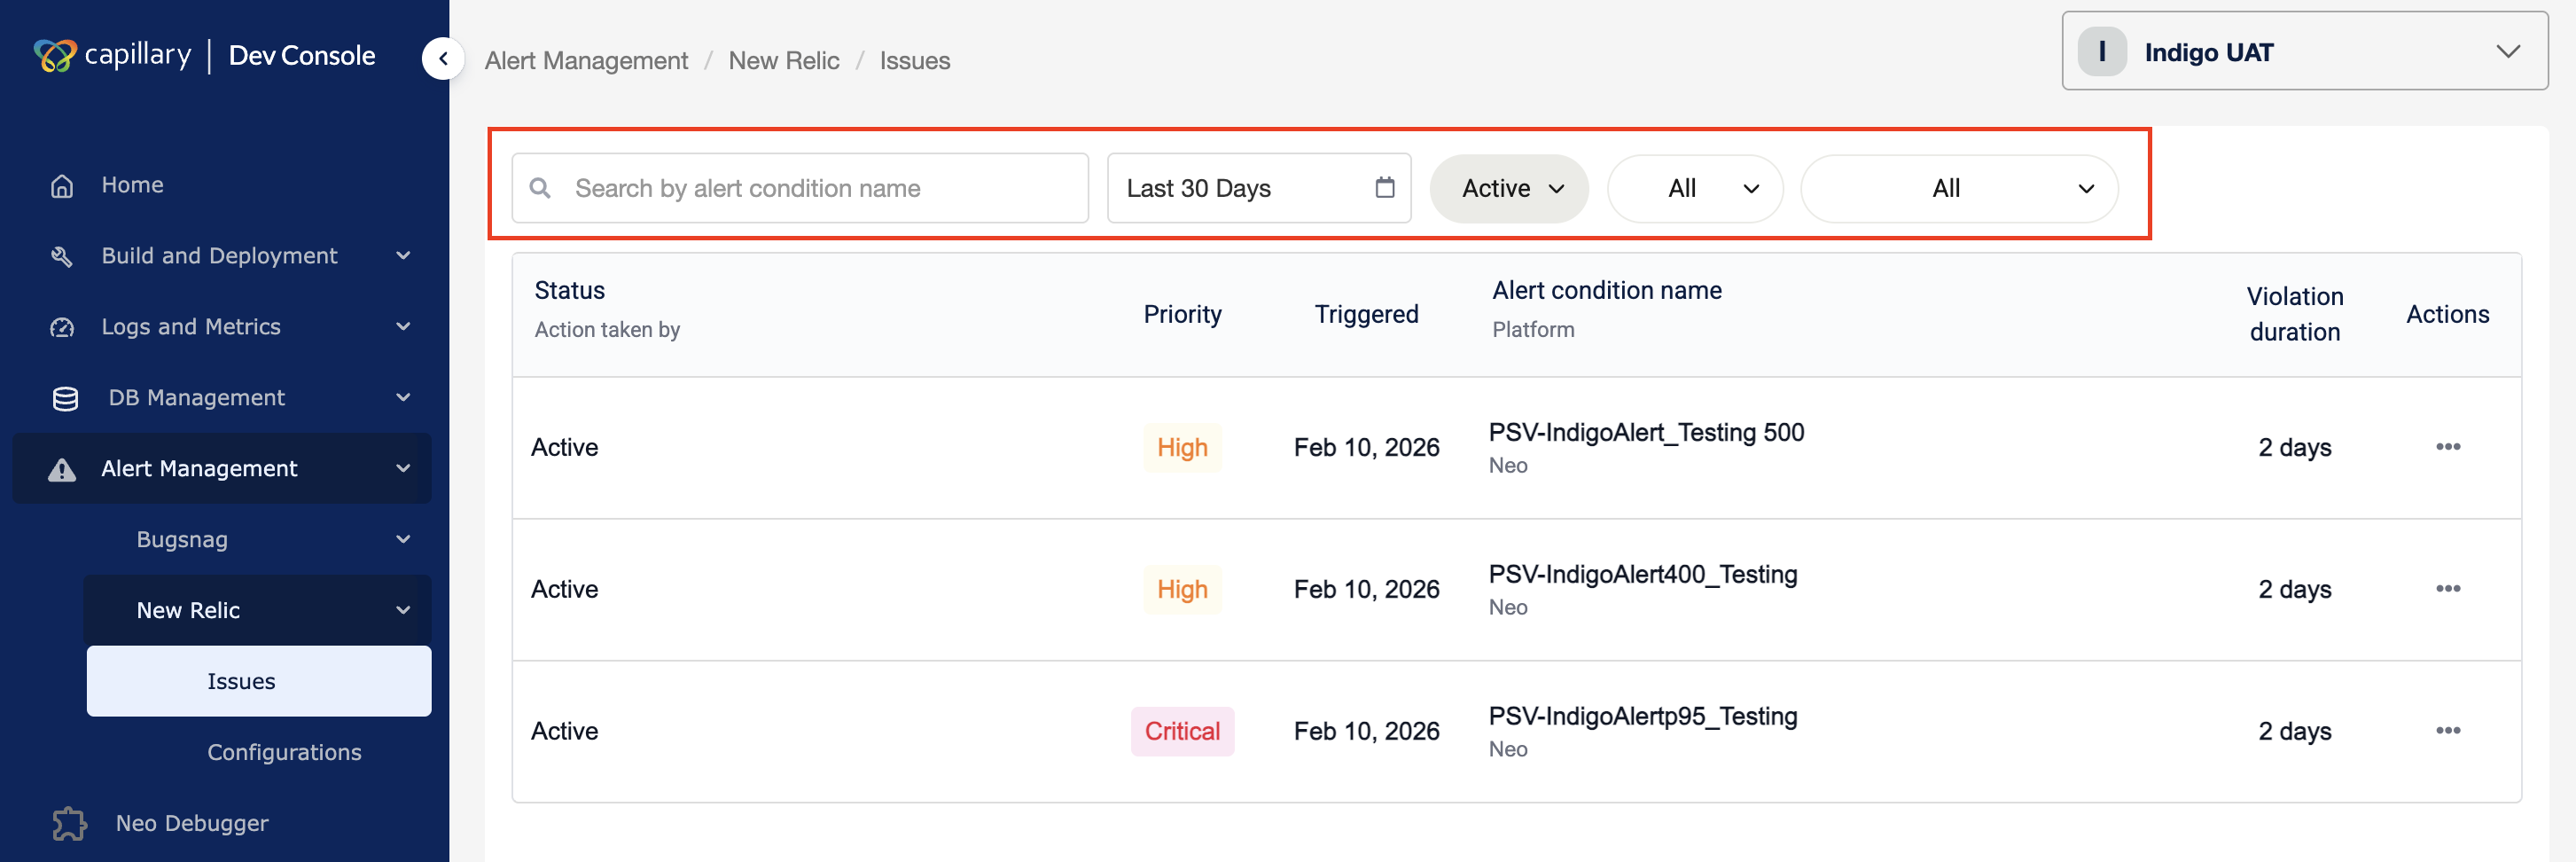
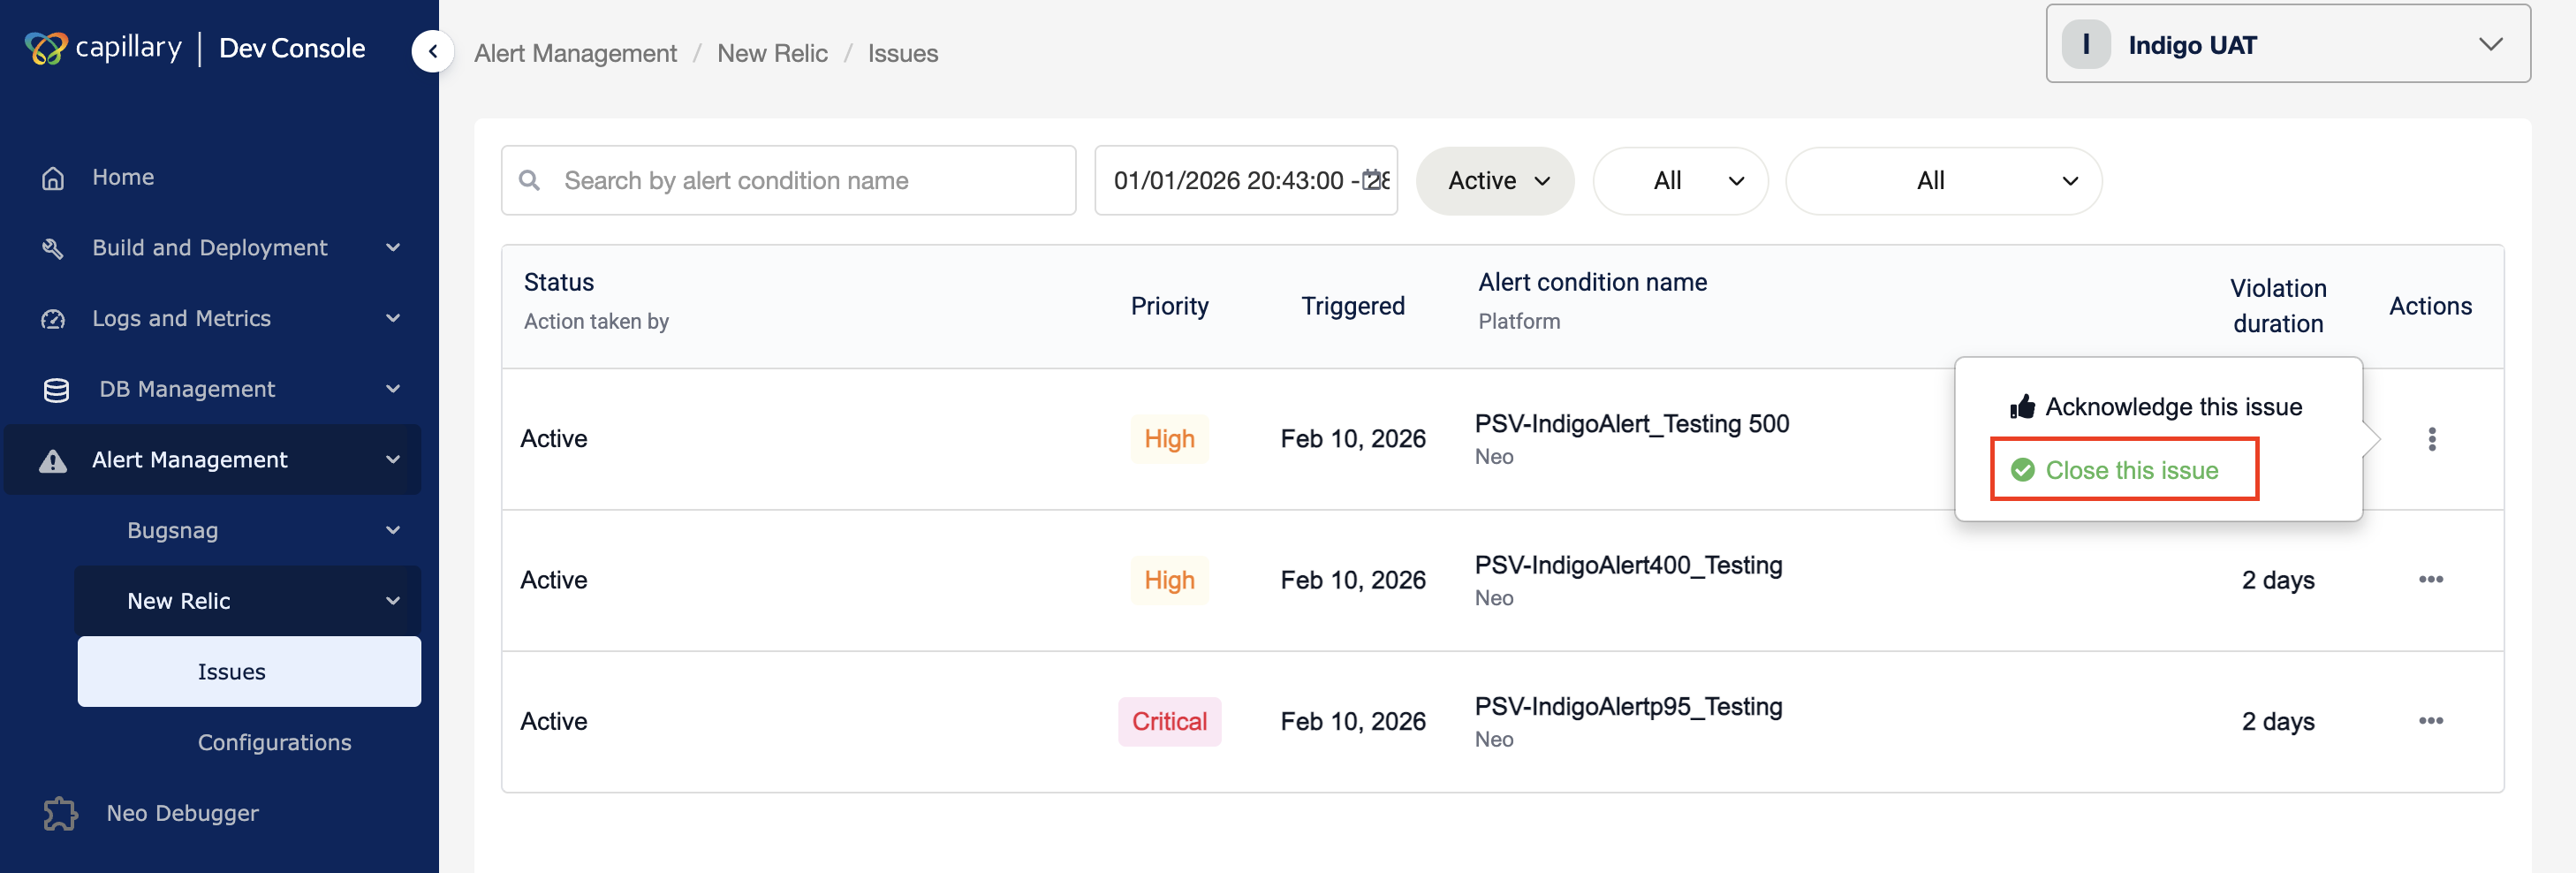
After you set up alerts, the Issues page displays all triggered alerts for the selected organization within the chosen time range. It shows alert status, priority, trigger time, platform, and violation duration, and allows you to acknowledge or close alerts.
Filter issues
You can filter issues to find alerts by time, status, priority, platform, or name.
To filter,
- Navigate to Alert Management → New Relic → Issues in Dev Console.
- Use the time filter to select the alert time range.
- Use the status filter to filter by alert status.
- Use the priority filter to filter by severity.
- Use the platform filter to view alerts for a specific platform.
- Enter an alert name in the search bar.
The alert list updates based on the selected filters.
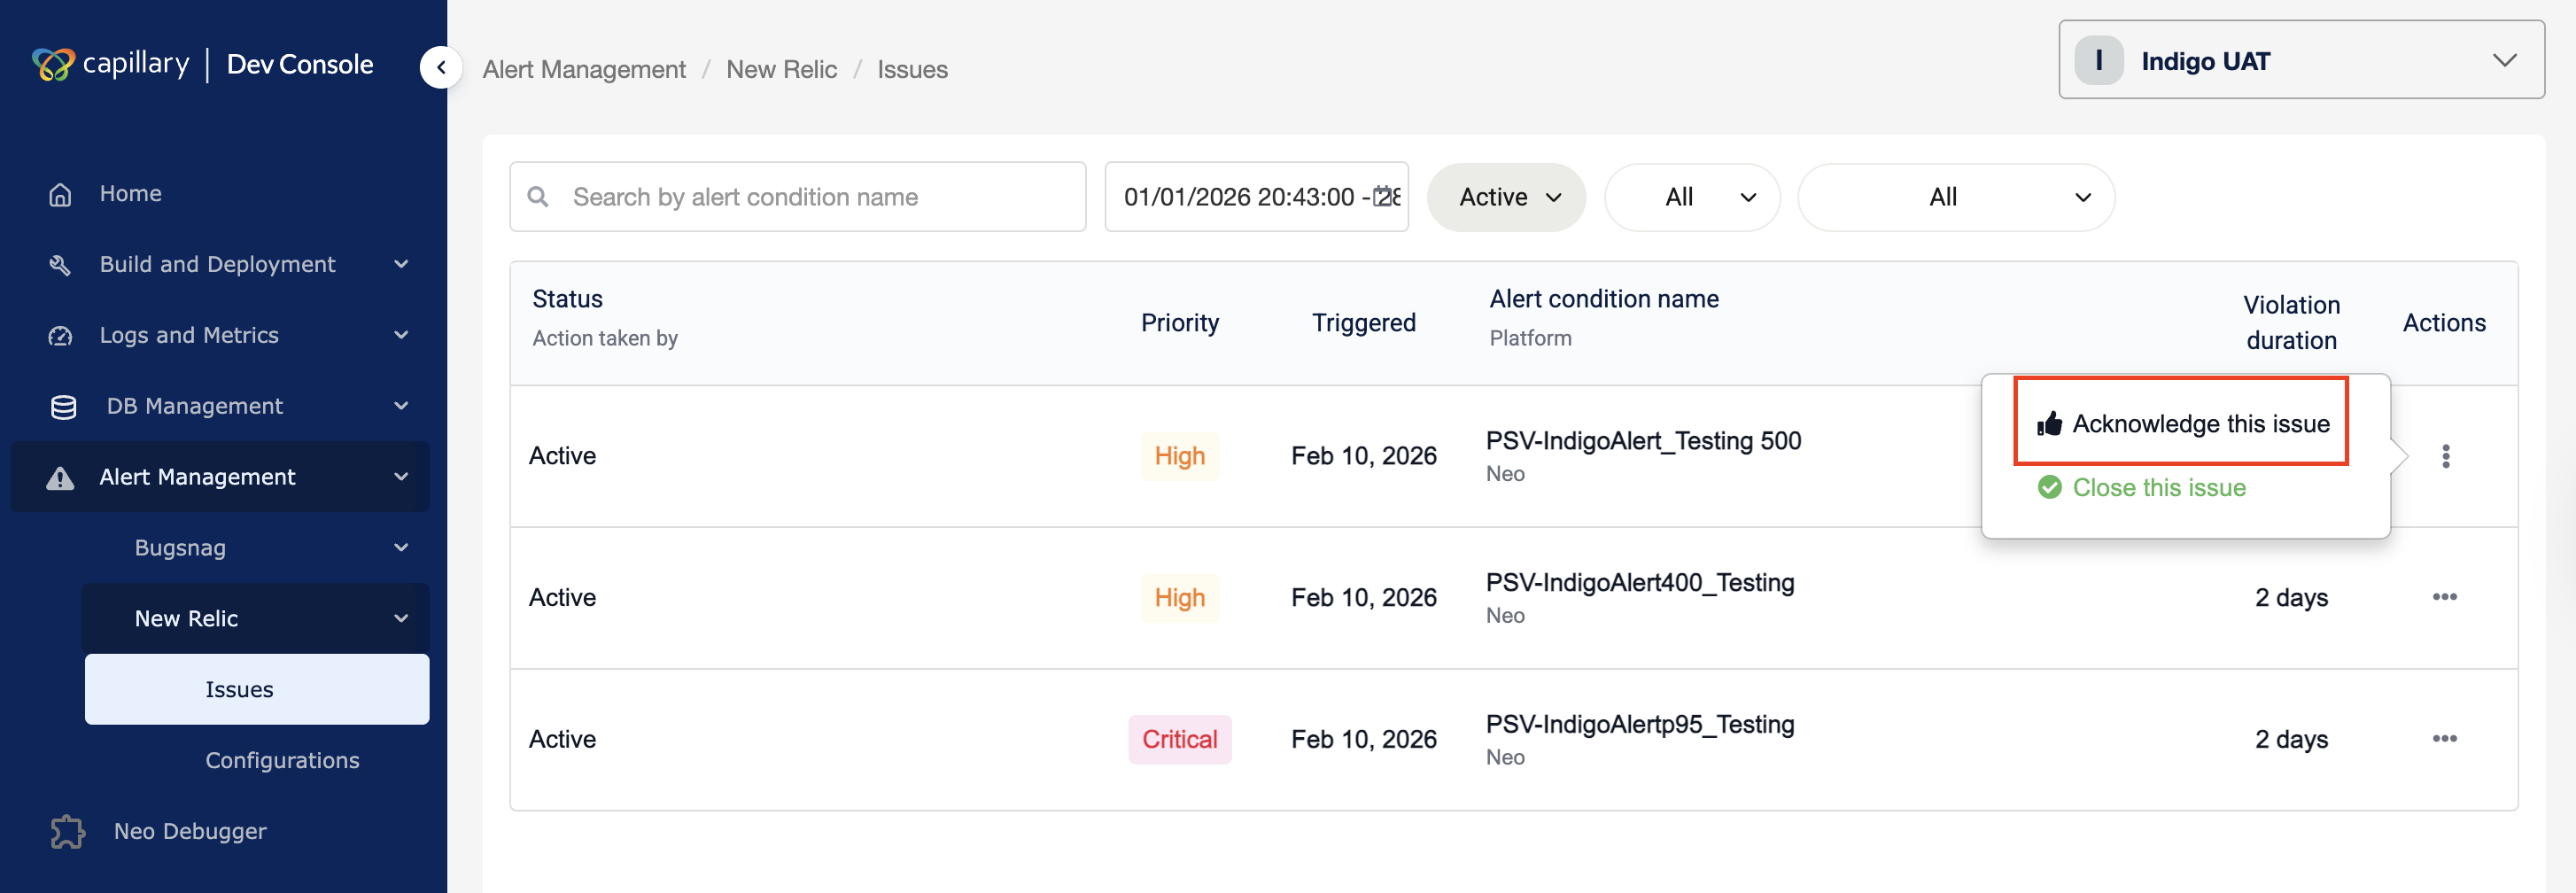
Acknowledge the issue
After you receive an alert in Slack, acknowledge it to indicate that it is recognized and under investigation. This prevents multiple people from working on the same issue.
- Navigate to Alert Management → New Relic → Issues.
- Locate the alert in the listing page.
- Click the ⋯ (action menu) next to the alert.
- Click Acknowledge this issue.
The alert status updates to Acknowledged and displays the user who took action.
After acknowledgement, you can close the issue once it is resolved.
Close the issue
Close an issue after you fix the problem to mark the alert as resolved.
- Navigate to Alert Management → New Relic → Issues.
- Locate the alert in the listing page.
- Click the ⋯ (action menu) next to the alert.
- Click Close this issue.
The issue is marked as resolved.
BugSnag
BugSnag integration in Dev Console provides UI error monitoring for Vulcan applications. It centralizes error visibility so teams can review, investigate, and manage UI issues without leaving the platform.
BugSnag captures application errors, groups them into issues, and provides metadata such as stack traces, affected users, and device details.
Each captured error is organized as an issue, and its status indicates where it is in the investigation lifecycle.
Issue Status
Each issue has a status that reflects its lifecycle:
- Open — Active issue that requires attention
- Fixed — Marked as resolved
- Ignored — Intentionally suppressed
Only open issues appear by default.
You must first configure the required thresholds to define how BugSnag monitors errors and triggers alerts.
Configuration
The Configuration page controls how BugSnag alerts behave. It includes the following sections:
- Stability targets — Set reliability thresholds for error-free user sessions
- Team notifications — Configure the Slack channel and webhook for alert delivery
- Alert configuration — Define notification rules, thresholds, and monitoring scope
These settings determine when alerts trigger and where notifications are sent.
Stability targets
Target stability
Sets the expected reliability level. It defines the percentage of sessions that should remain error-free. Use the up/down controls to set the value.
Critical stability
Sets the failure threshold. If stability drops below this value, the situation is treated as critical and requires immediate action. Use the up/down controls to set the value.
Critical stability must always be lower than target stability.
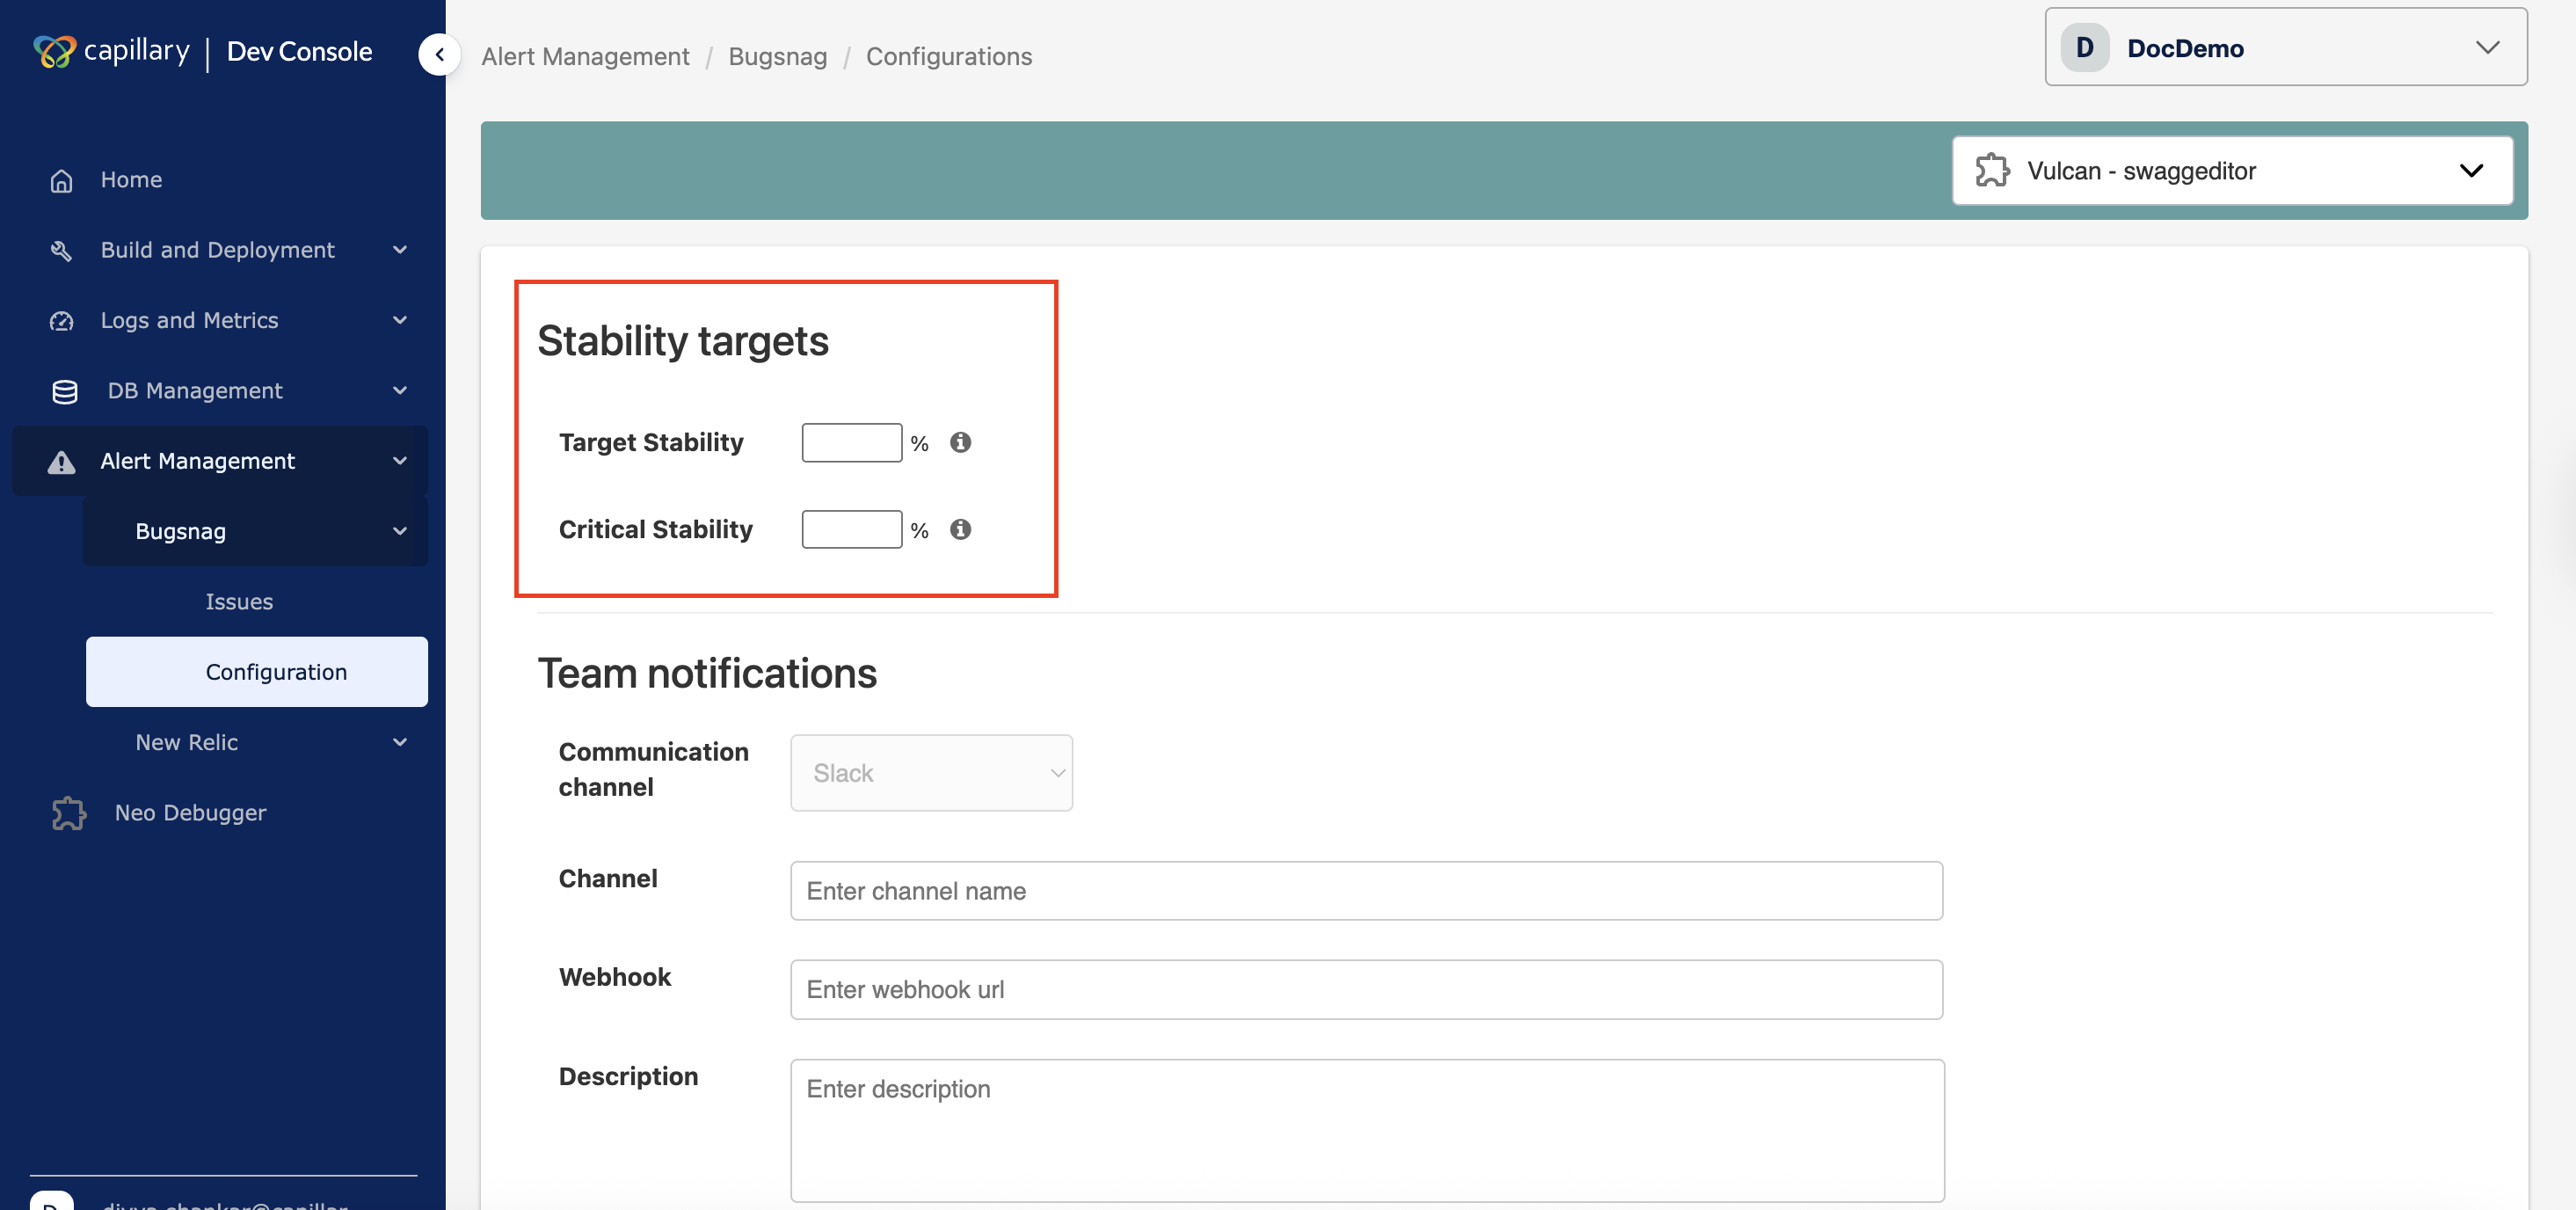
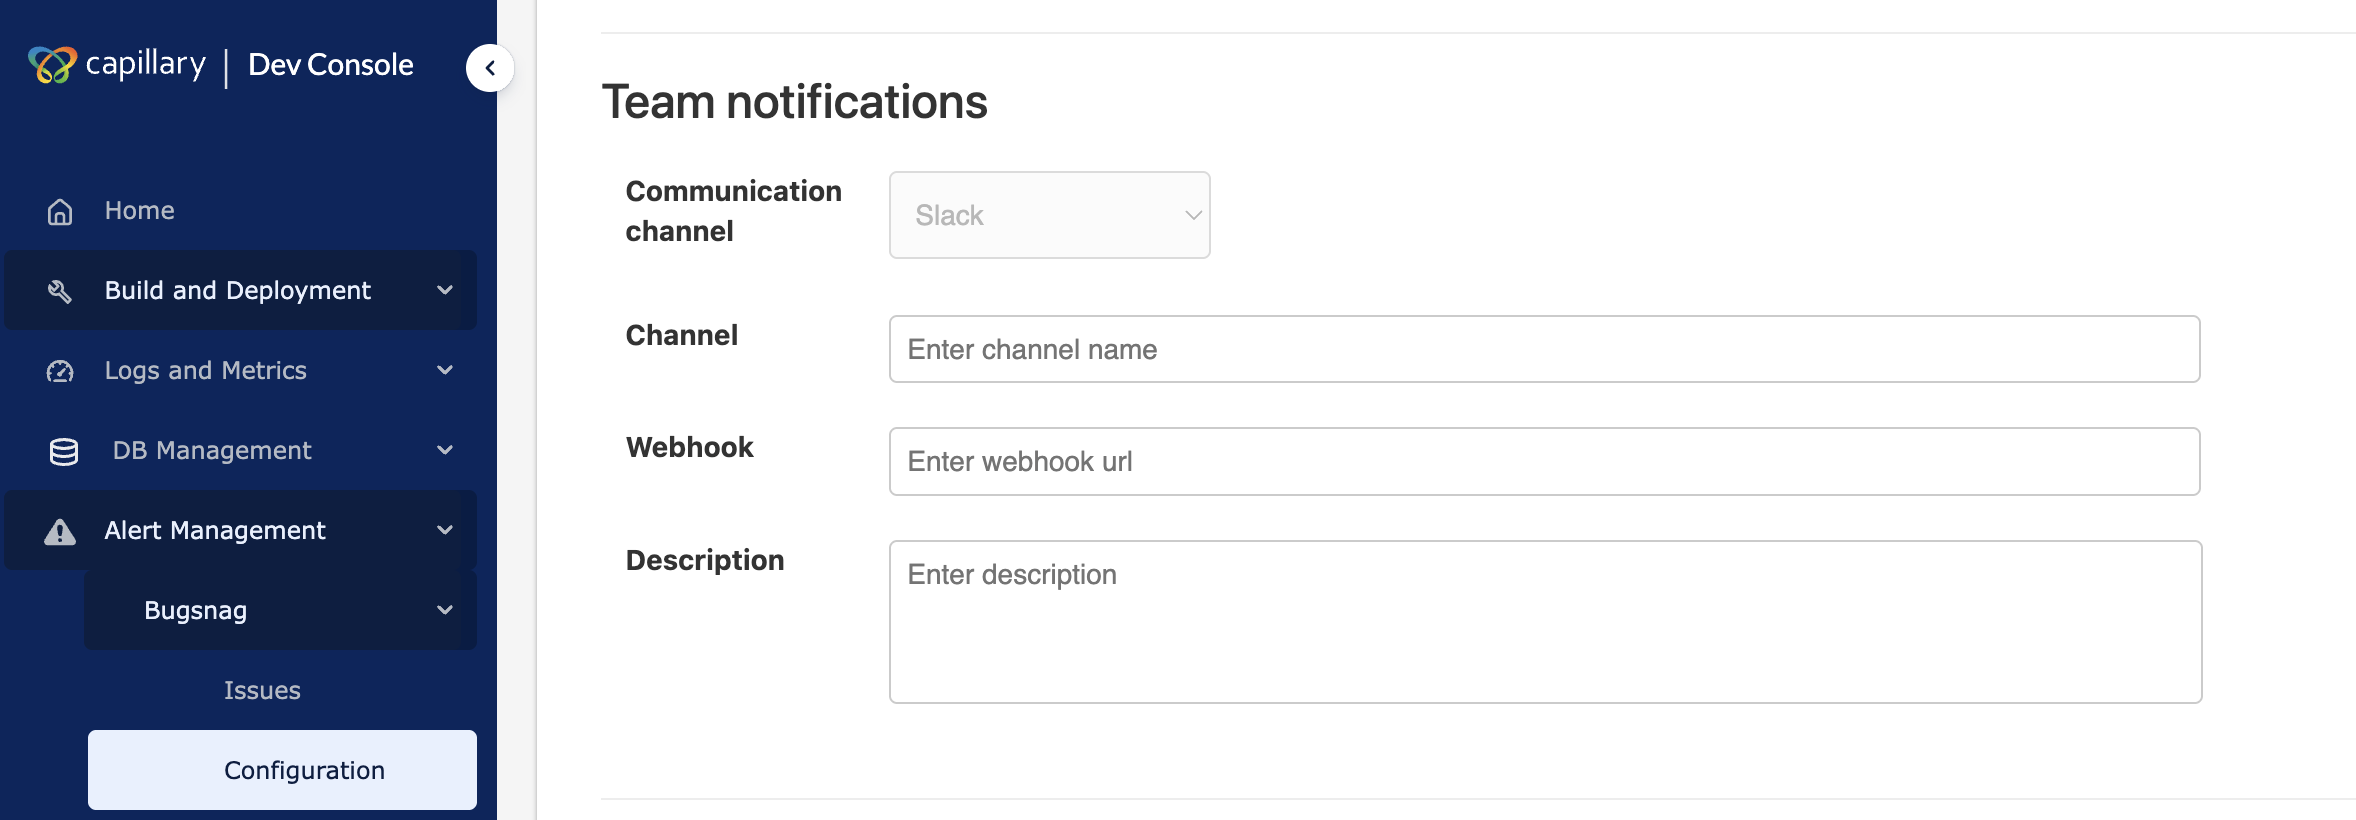
Team notifications
The Team notifications section controls where BugSnag sends alert messages. You configure a Slack channel and webhook so the team receives real-time notifications for UI issues.
To configure team notifications,
- Open the Configuration page under Alert Management → BugSnag.
- In Channel, enter the Slack channel name.
- In Webhook, paste the Slack webhook URL.
- (Optional) Enter a description.
- Click Save.
BugSnag sends alerts to the configured Slack channel after setup.
Note: Currently, only Slack is available as the communication channel.
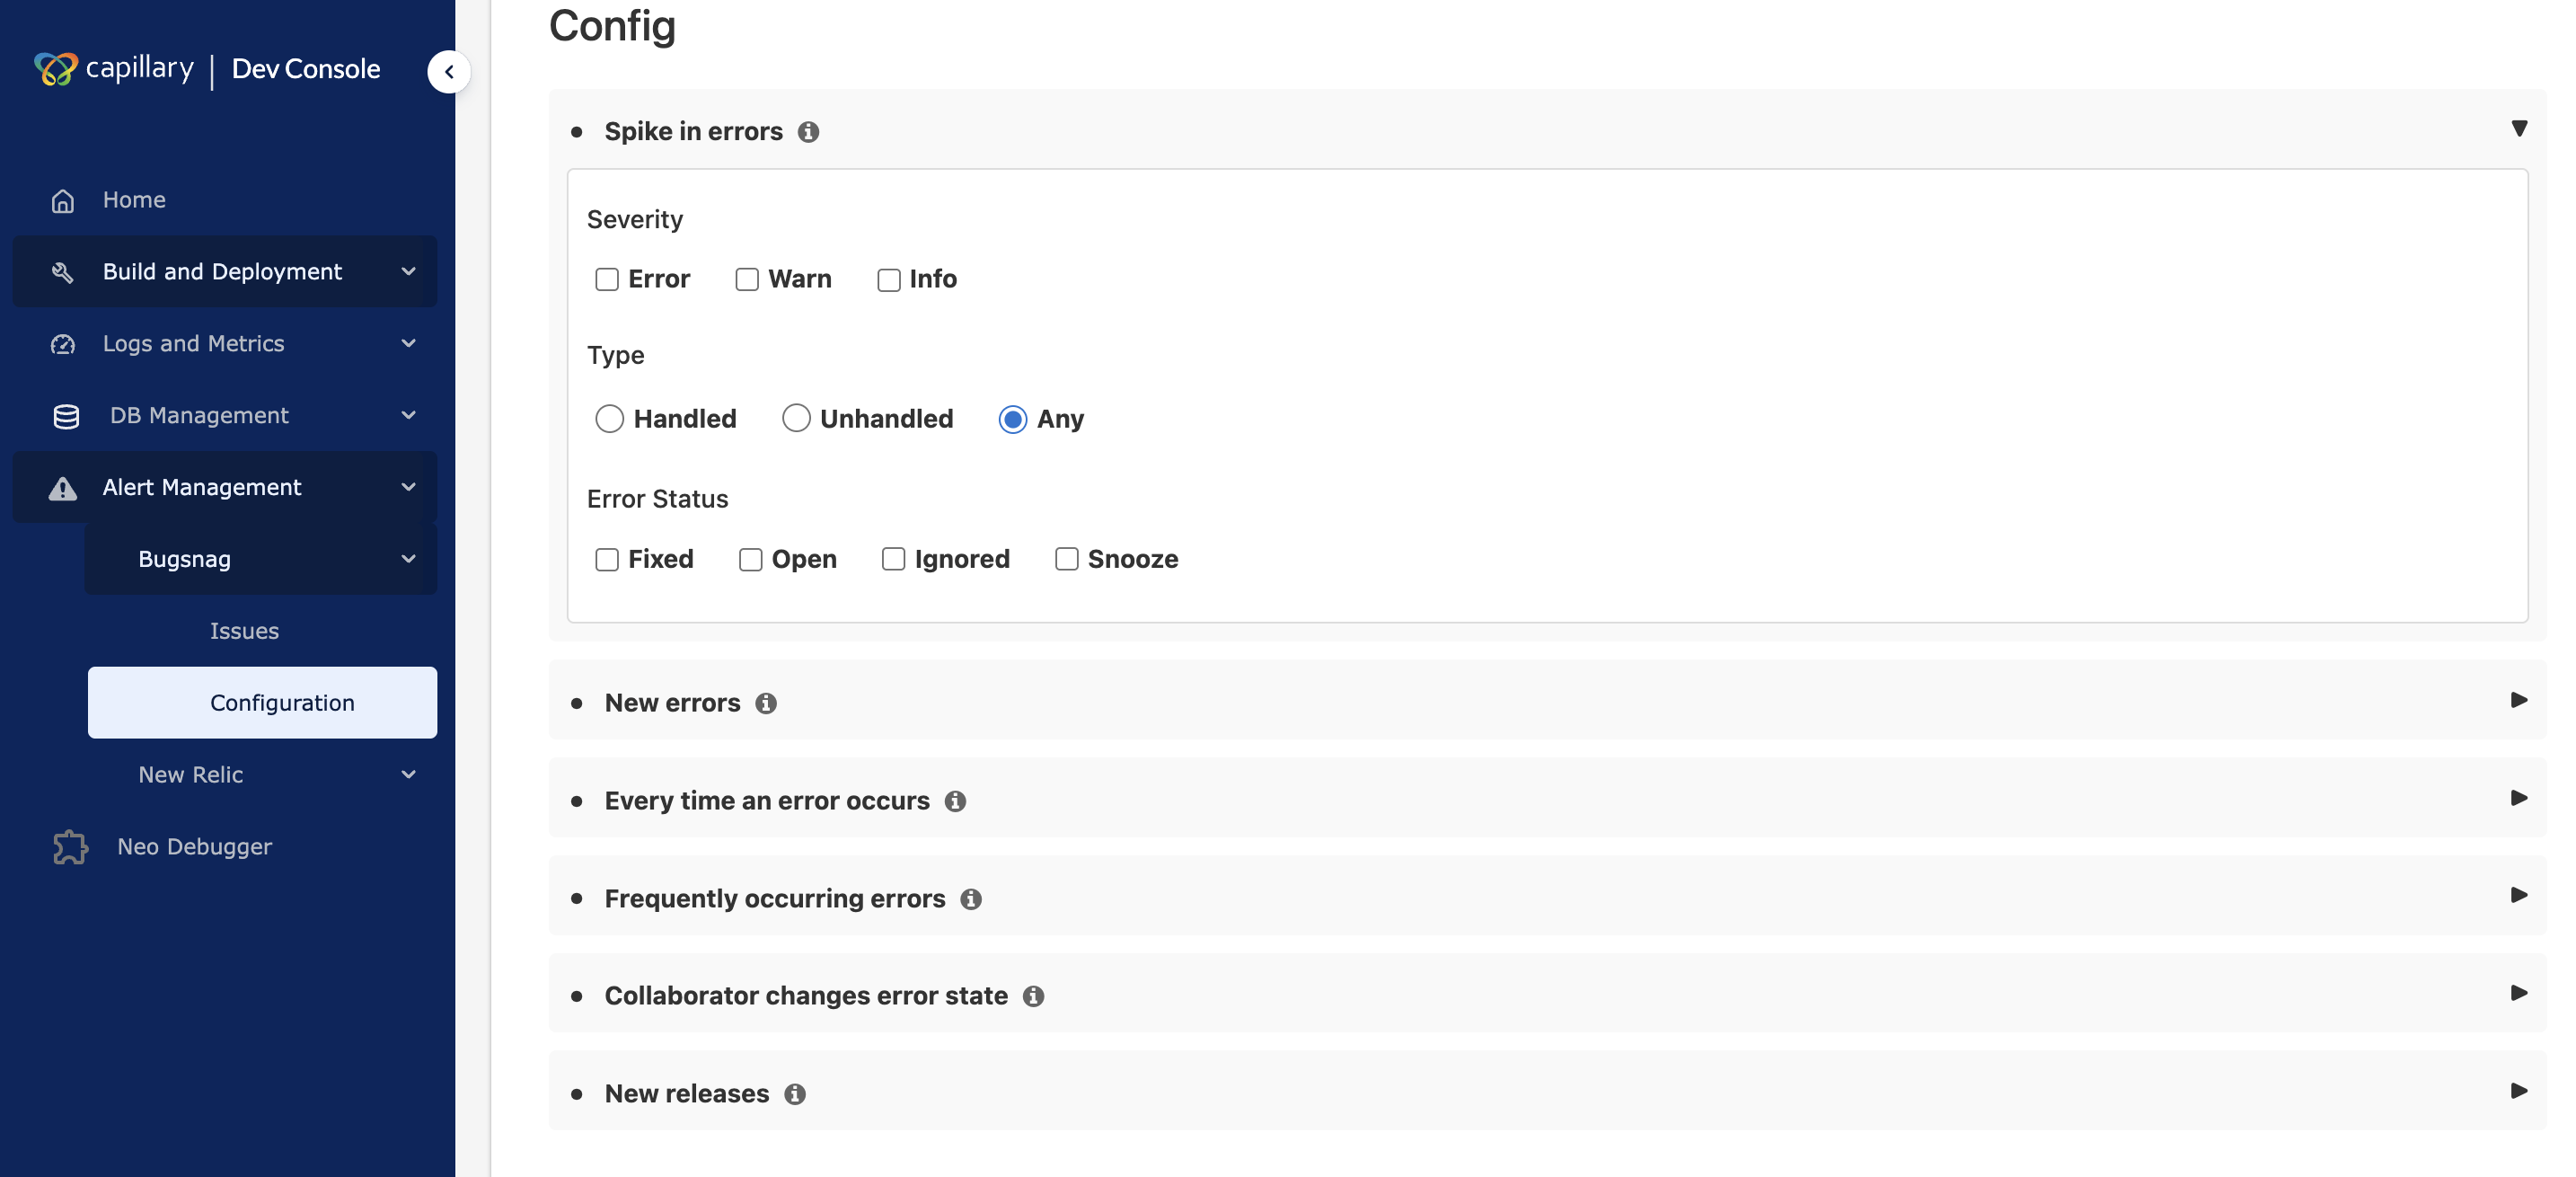
Config
The Config section controls when BugSnag sends notifications and what types of errors trigger alerts. It lets you define alert rules so the team receives only relevant notifications.
You can configure alerts for:
- Spike in errors — Notifies the team when there is a sudden increase in error volume. It helps detect outages or rapid degradation early.
- New errors — Notify when a new error appears. It helps teams identify new issues as soon as they occur. It provides full visibility but can generate a high volume of alerts.
- Every time an error occurs — Notify whenever an error happens. It provides full visibility but can generate a high volume of alerts.
- Frequently occurring errors — Notify when an error occurs repeatedly within a defined threshold. It helps teams focus on recurring issues.
- Collaborator changes error state — Notify when a user changes the status of an issue, such as marking it fixed or ignored. This keeps the team informed about issue status updates and ownership changes.
- New releases — Notify when a new app version is deployed. It helps teams correlate errors with recent releases.
You can specify the release stage that BugSnag should track. A release stage is an environment label, such as production, staging, or development. If the app does not appear automatically, enter the exact stage name reported by the application. Alerts apply only to the selected release stage.
You can refine each alert further by configuring the following options.
Severity filter
The severity filter lets you choose which severity levels trigger alerts. You can configure alerts for Error, Warning, or Info events.
Error type filter
The error type filter lets you choose which error sources are tracked. You can track handled errors reported manually by the application, unhandled errors captured automatically, or both.
Threshold and period
The threshold and period settings define how many times an error must occur and within what time window before a notification is sent.
Issues
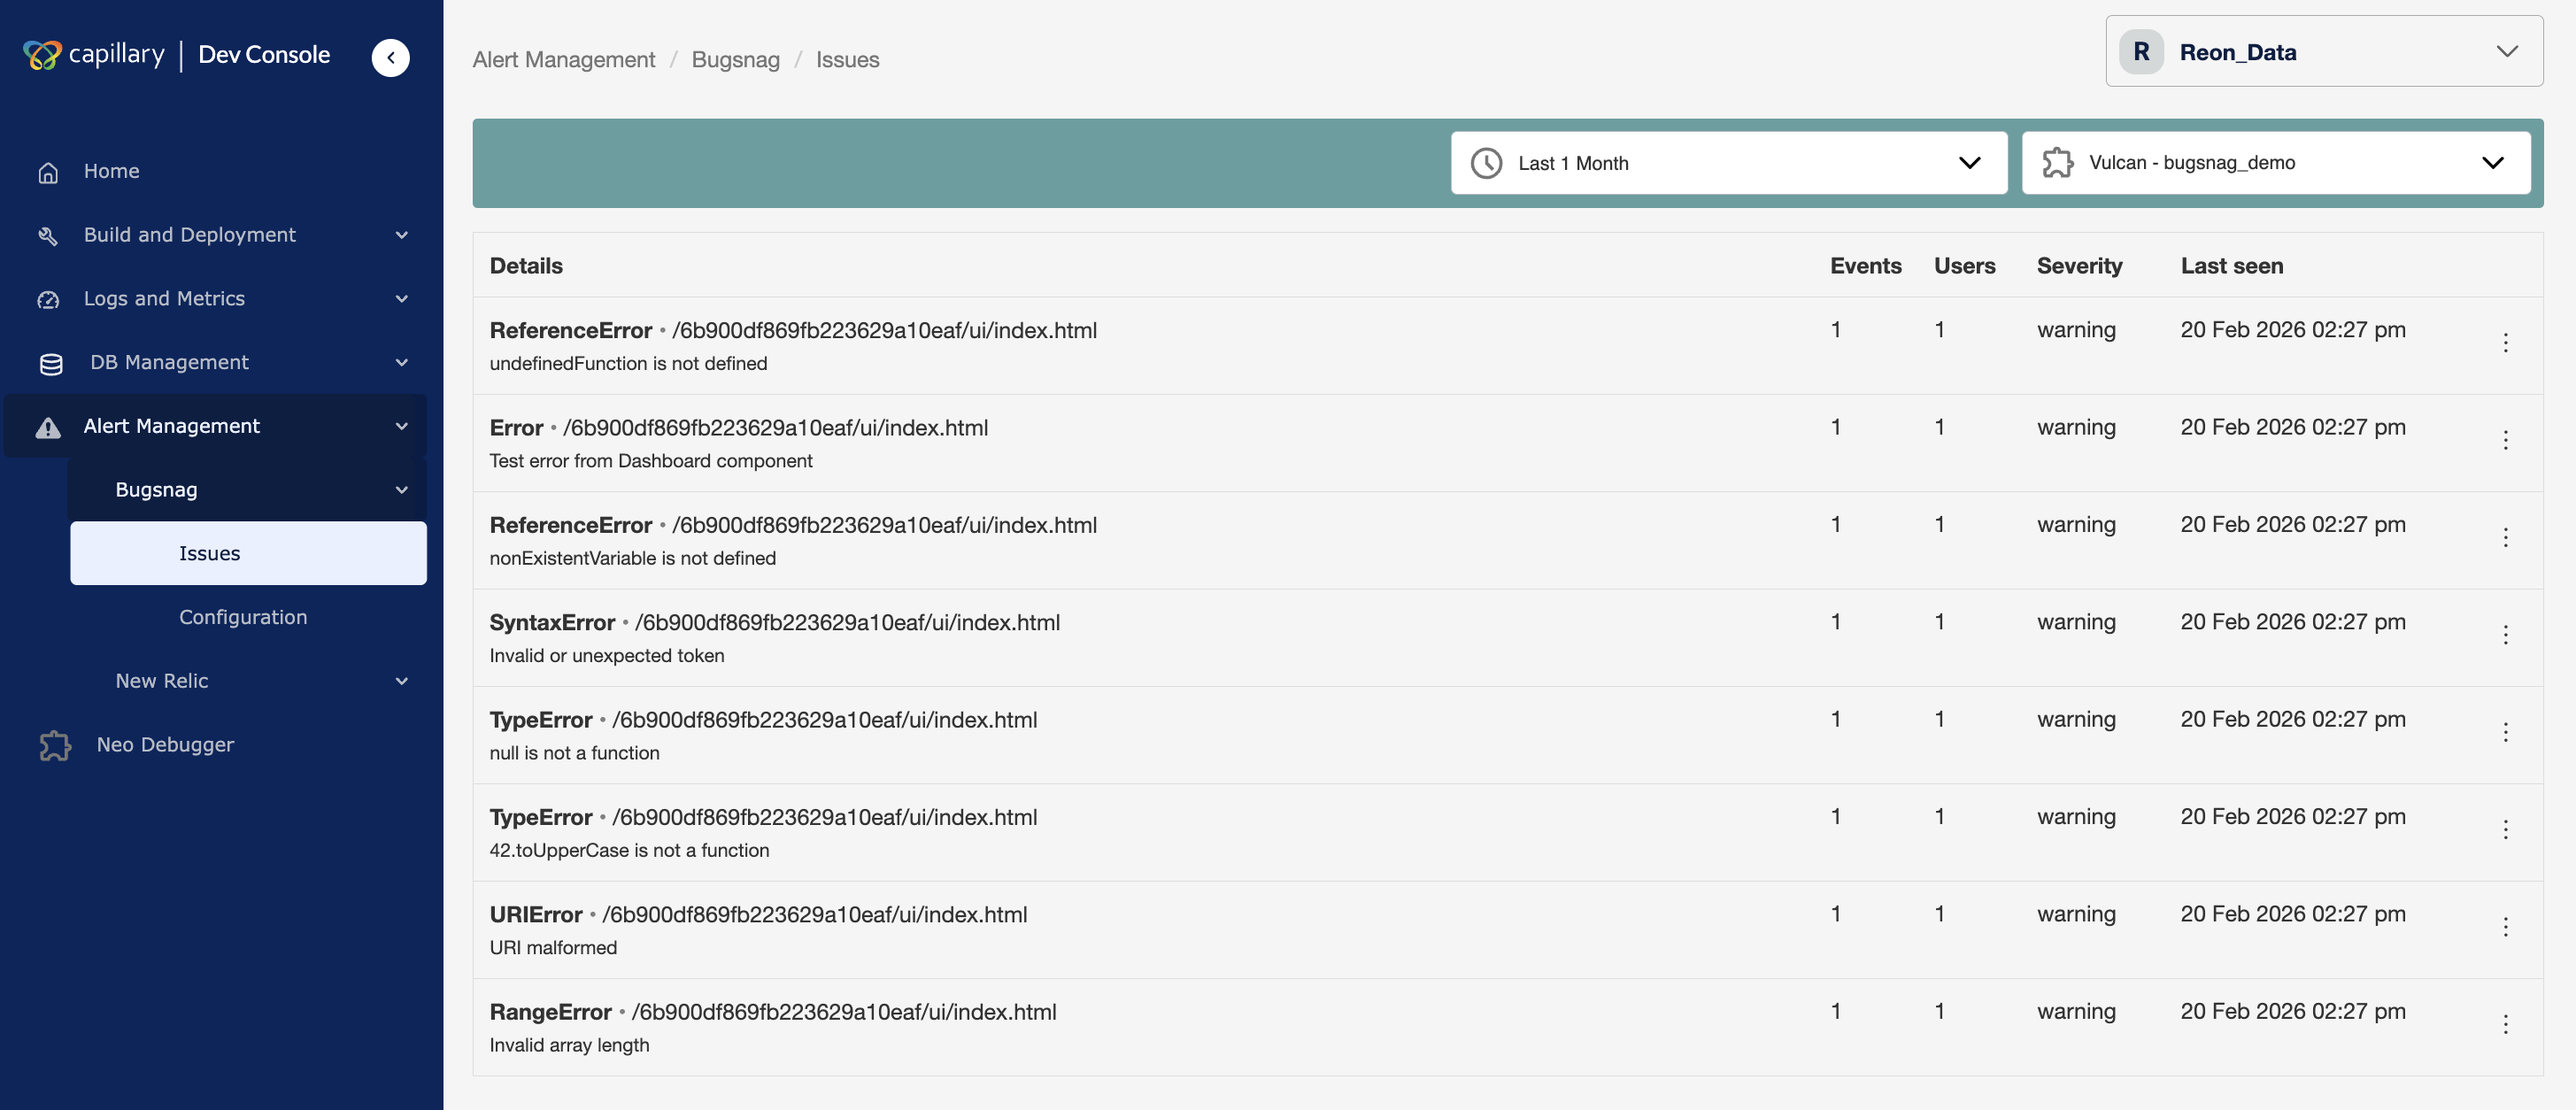
The Issues page displays UI errors grouped into issues for the selected organization and application. It provides a centralized view to review errors, assess impact, and manage issue status.
Each issue represents a unique error pattern. BugSnag groups repeated occurrences of the same error into a single issue so teams can focus on investigation instead of individual events.
Issue information
Each issue shows the following fields:
- Details — Identifies the error and where it occurred
- Events — Number of times the error occurred
- Users — Number of users impacted
- Severity — Error classification: Error, Warning, or Info
- Last seen — Most recent occurrence timestamp
You can select an issue to view detailed metadata.
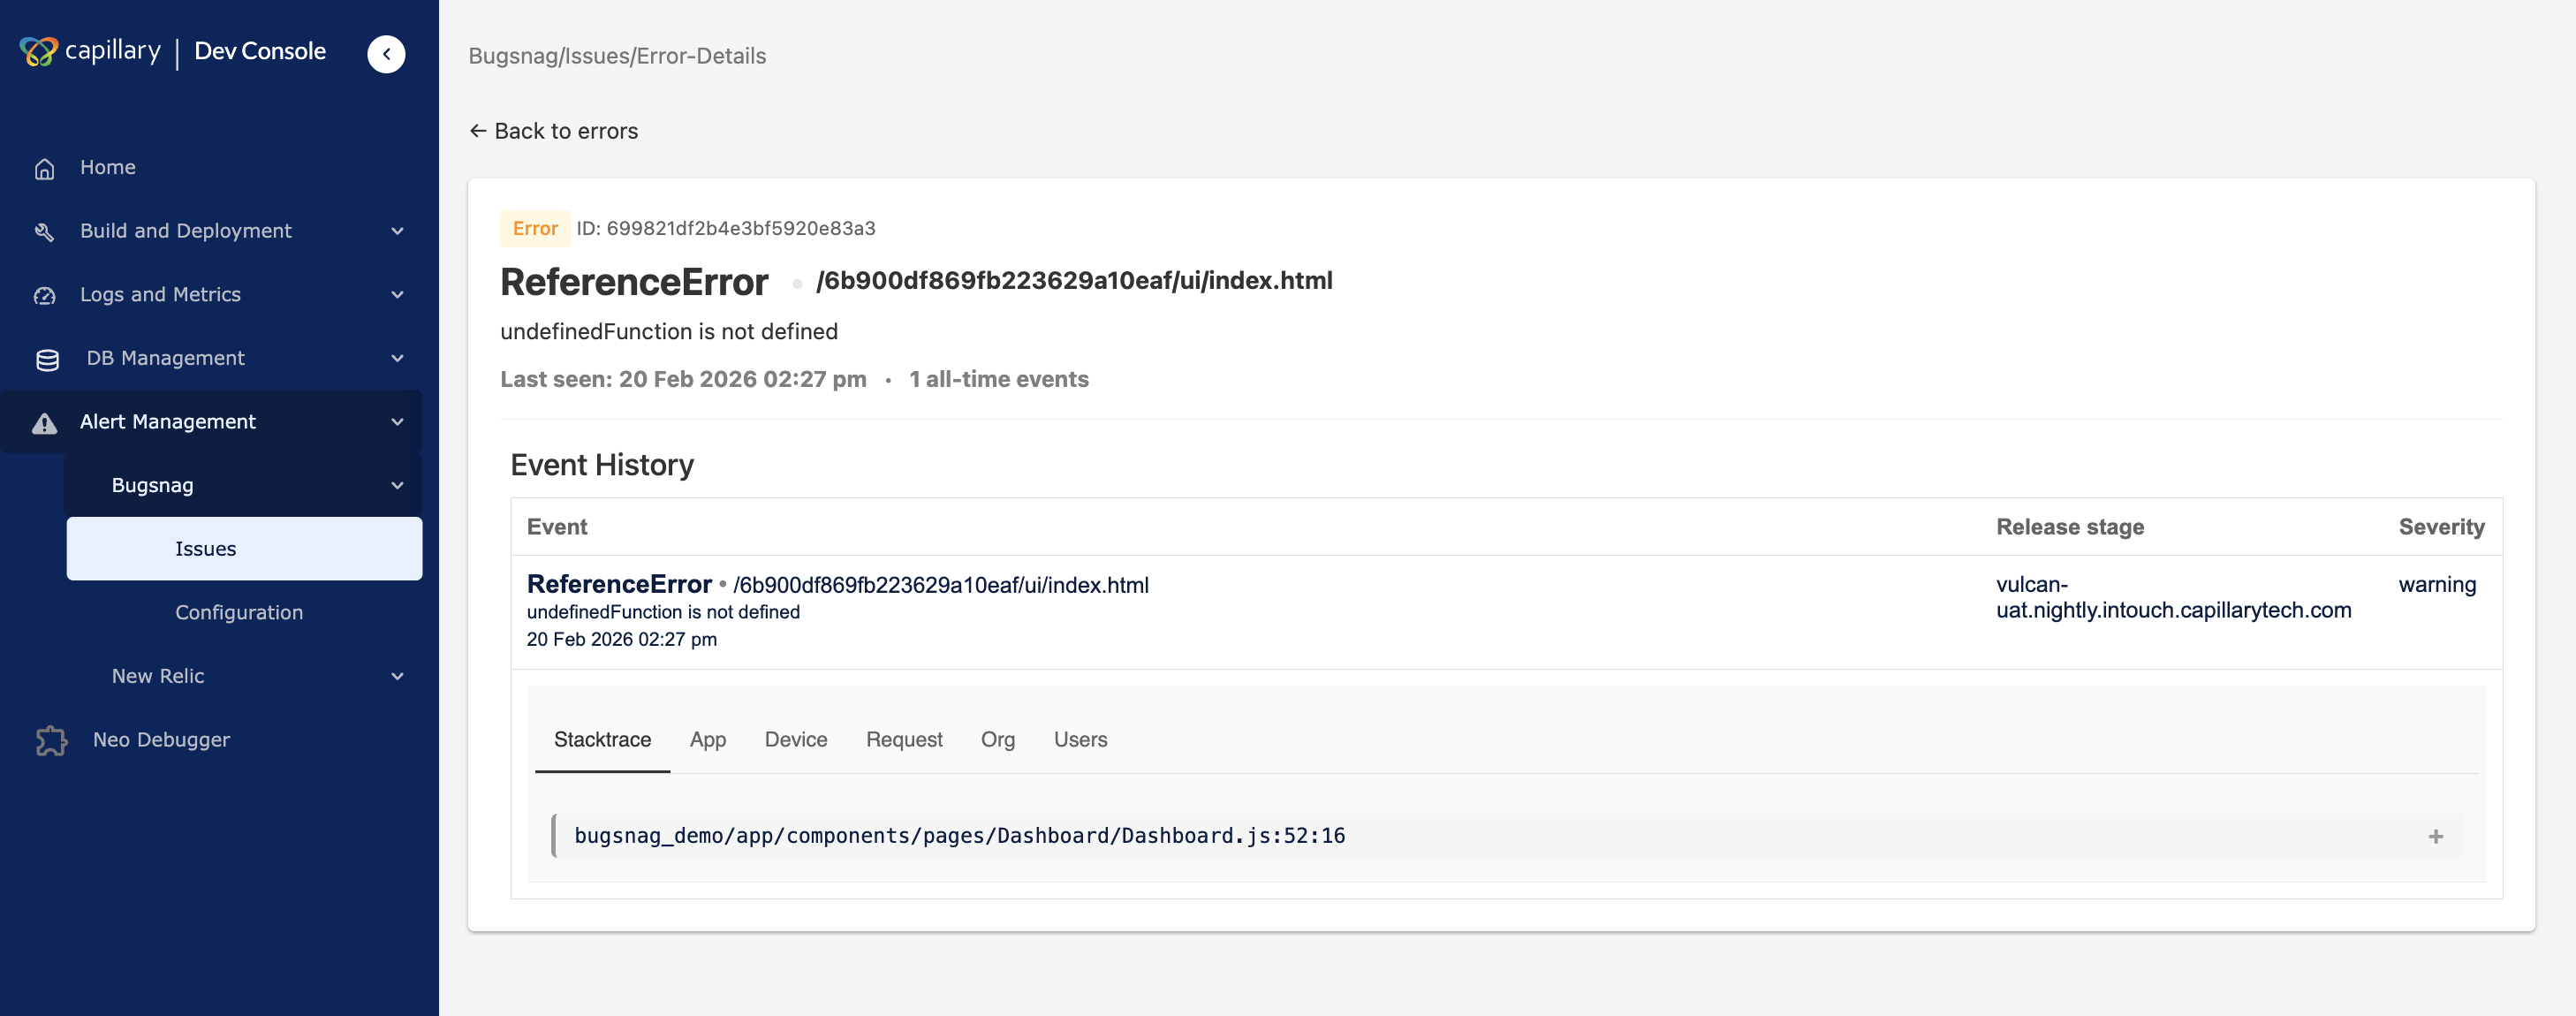
View issues
You can select an issue to open the Event History tab, which displays diagnostic metadata about the error. The following information is available.
- Stacktrace: Code location of the error
The stack trace shows the sequence of function calls that led to the error. It identifies the exact code location where the failure occurred and supports debugging and root-cause analysis. - App: Version and release information
Application details display the app version and release information associated with the issue. This helps determine whether the error is tied to a specific release. - Device: Environment and device metadata
Device details show environment information such as operating system, device type, and runtime context. This helps identify whether the issue is limited to certain platforms or devices. - Request: Associated network requests
HTTP request details show the network request linked to the error. This includes request context that helps explain how the error was triggered. - Org: Organization ID and name
Org displays the organization ID and name where the issue has occurred. - Users: Information about affected users
User metadata displays information about users impacted by the issue. This helps measure the scope of impact and prioritize fixes.
Once the issue is resolved, update the status.
Change issue status
You can update the status of an issue to reflect its investigation state.
To change the issue status:
- Navigate to Alert Management → BugSnag → Issues in Dev Console.
- Select the issue from the list.
- Choose the status action:
- Mark as Fixed to indicate the issue is resolved
- Mark as Ignored to suppress the issue
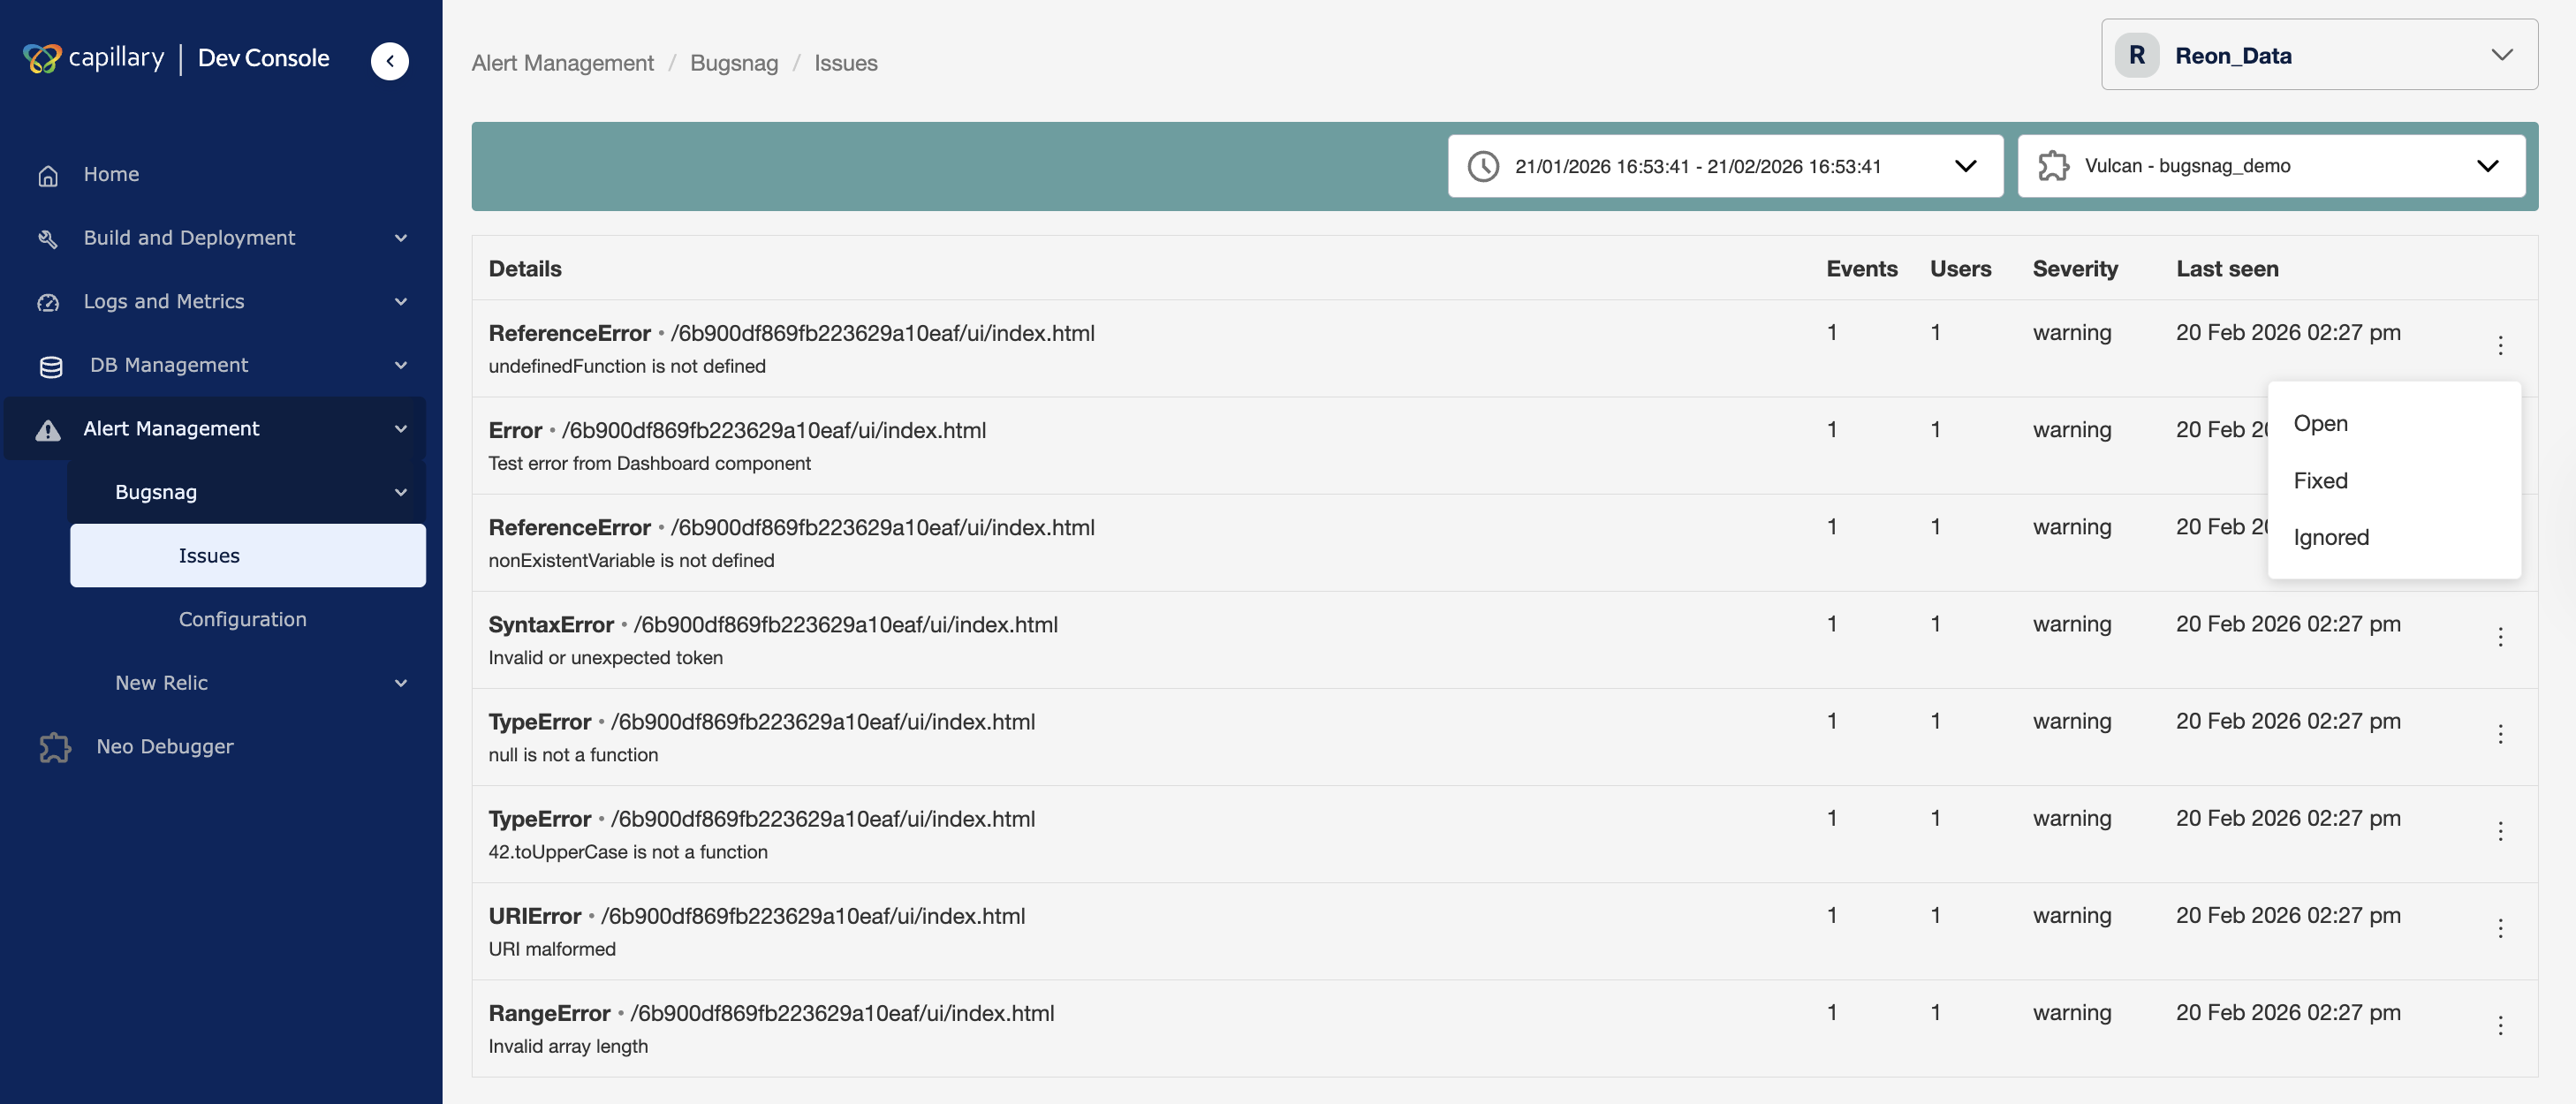
The issue status updates immediately and is reflected in the issue list.
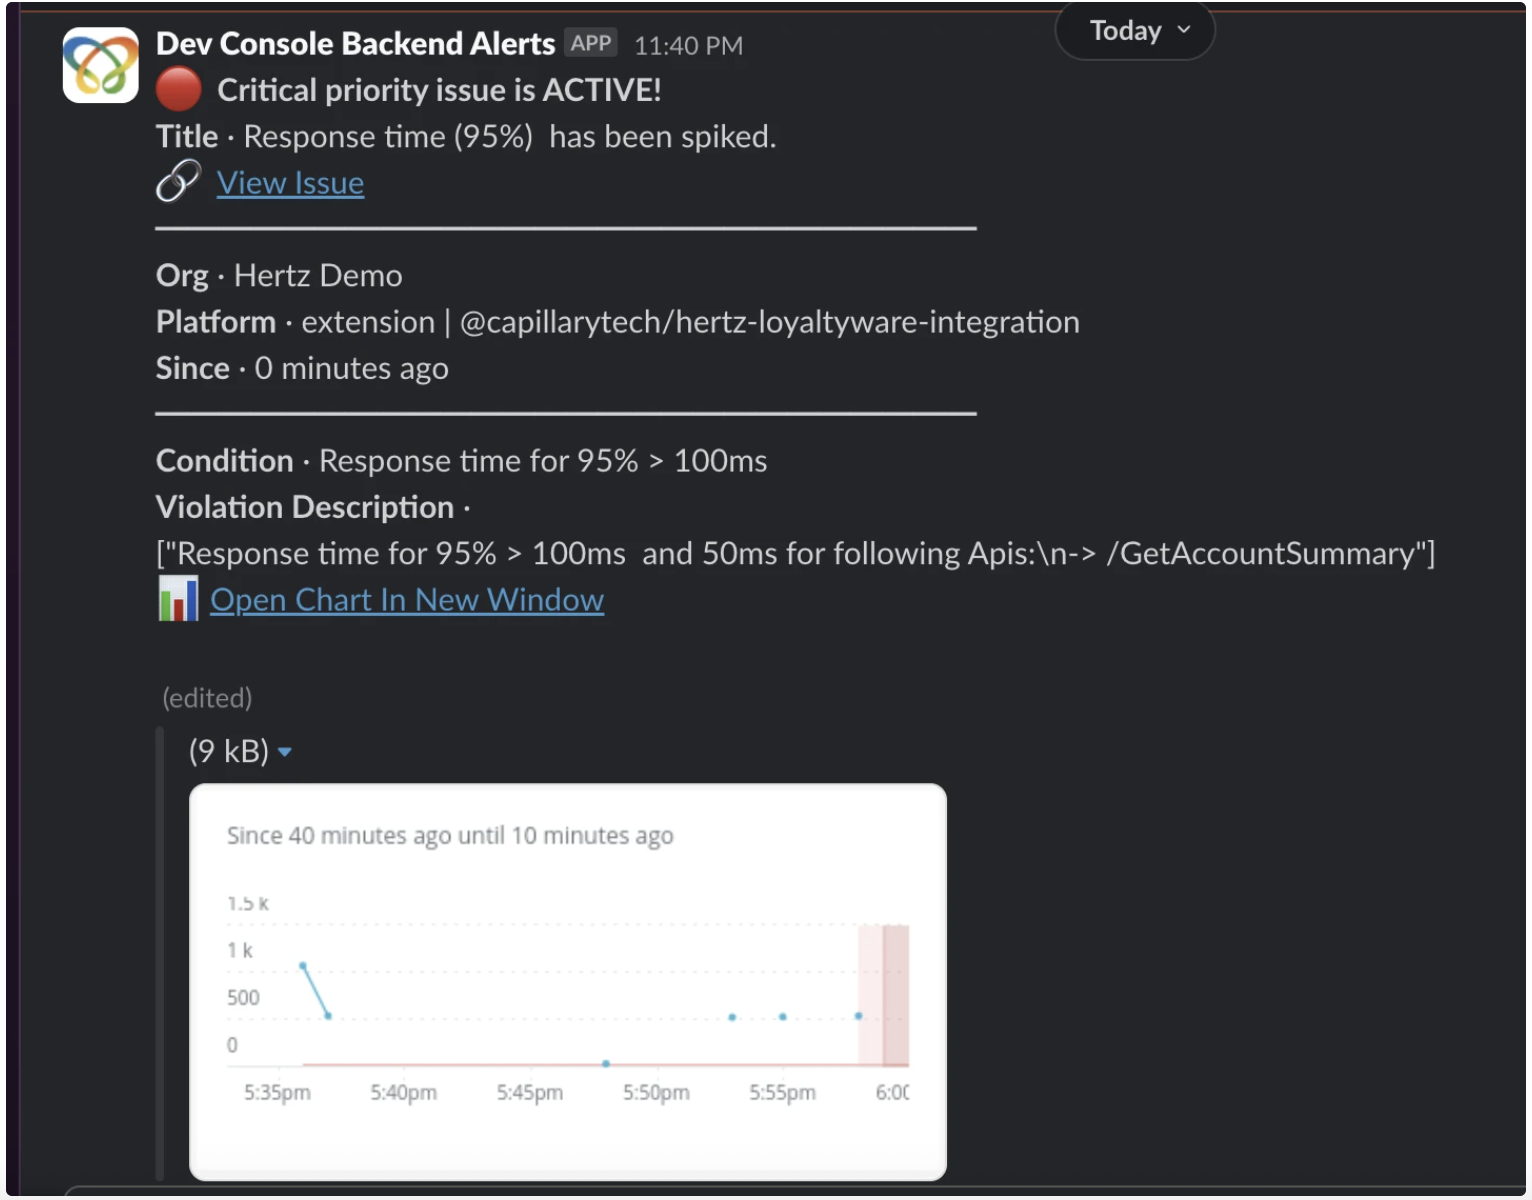
Sample alert message
The Issues page under Alert Manager displays all active and historical alert violations for the selected organization. The same alerts are also delivered to the configured Slack channel based on alert settings. Below is a sample alert based on configured alert.
FAQs
1. What is Alert Manager used for?
Answer: Alert Manager provides organization-level monitoring and sends notifications when configured thresholds are violated. It helps teams detect, investigate, and resolve issues before they impact users.
2. Which platforms does Alert Manager support?
Answer: Alert Manager supports backend extensions, core platform APIs, and Vulcan UI applications through New Relic and BugSnag integration.
3. Why do I need to configure a Slack webhook?
Answer: Alert Manager sends notifications to a Slack channel. You must configure a webhook so alerts can be delivered to your team.
4. Can I configure more than one Slack channel?
Answer: No. You can configure only one Slack communication channel at a time. Alerts are delivered to the currently configured channel.
5. What happens if the webhook is not configured?
Answer: Until the webhook is configured, both the Issues and Configuration pages redirect to the Slack setup screen.
6. How many thresholds can I add to an alert condition?
Answer: Each alert condition supports a maximum of two thresholds: one Warning and one Critical.
7. Can I edit an alert after creating it?
Answer: Yes. You can edit thresholds and notification settings. You cannot change the selected platform or metric after creation. To change them, create a new alert condition.
8. What is the difference between disabling and deleting an alert?
Answer: Disabling an alert stops it temporarily but keeps the configuration. Deleting an alert permanently removes it and cannot be undone.
9. What alert statuses are available?
Answer: An alert can have one of the following statuses: Active, Acknowledged, or Closed.
10. What happens when I acknowledge an alert?
Answer: Acknowledging an alert indicates that someone is working on it. This prevents duplicate investigation.
11. What happens when I close an alert?
Answer: Closing an alert marks the issue as resolved and ends the alert lifecycle.
12. Why do I not see any issues on the page?
Answer: If the selected organization does not have supported applications enabled or no alerts were triggered during the selected time range, the Issues page shows no results.
Updated 3 months ago