
View App Request Logs
The App Request Logs page in the Dev Console displays all transactions that an application sends to New Relic within a selected time range. You can use this page to trace requests, monitor performance, debug issues, and validate system behavior for supported applications. Each log entry includes detailed request and response information, such as headers, timestamps, and status codes.
You can view logs for the following applications:
-
Neo
-
Vulcan
-
API Gateway
-
Sol API Gateway
-
Gateway Extension
-
Intouch API
-
Intouch API v3
The App Request Logs supports filters that help you quickly narrow down transactions based on your needs. For Neo applications, you can access additional execution details through Neo Log Insights.
Accessing App Request Logs
To access App Request Logs, navigate to Logs and Metrics > App Request Logs from the left pane of the Dev Console.
The App Request Logs page opens.
The following image shows the App Request Logs page.

Once you open the App Request Logs page, you can fetch the logs for the required application.
Viewing application logs in App Request Logs
You can view application logs based on a selected time range, application, and filters.
To view the logs,
-
On the Platform Metrics page, select a date range from the drop-down and click Apply.
Note: The maximum date range you can select is 48 hours.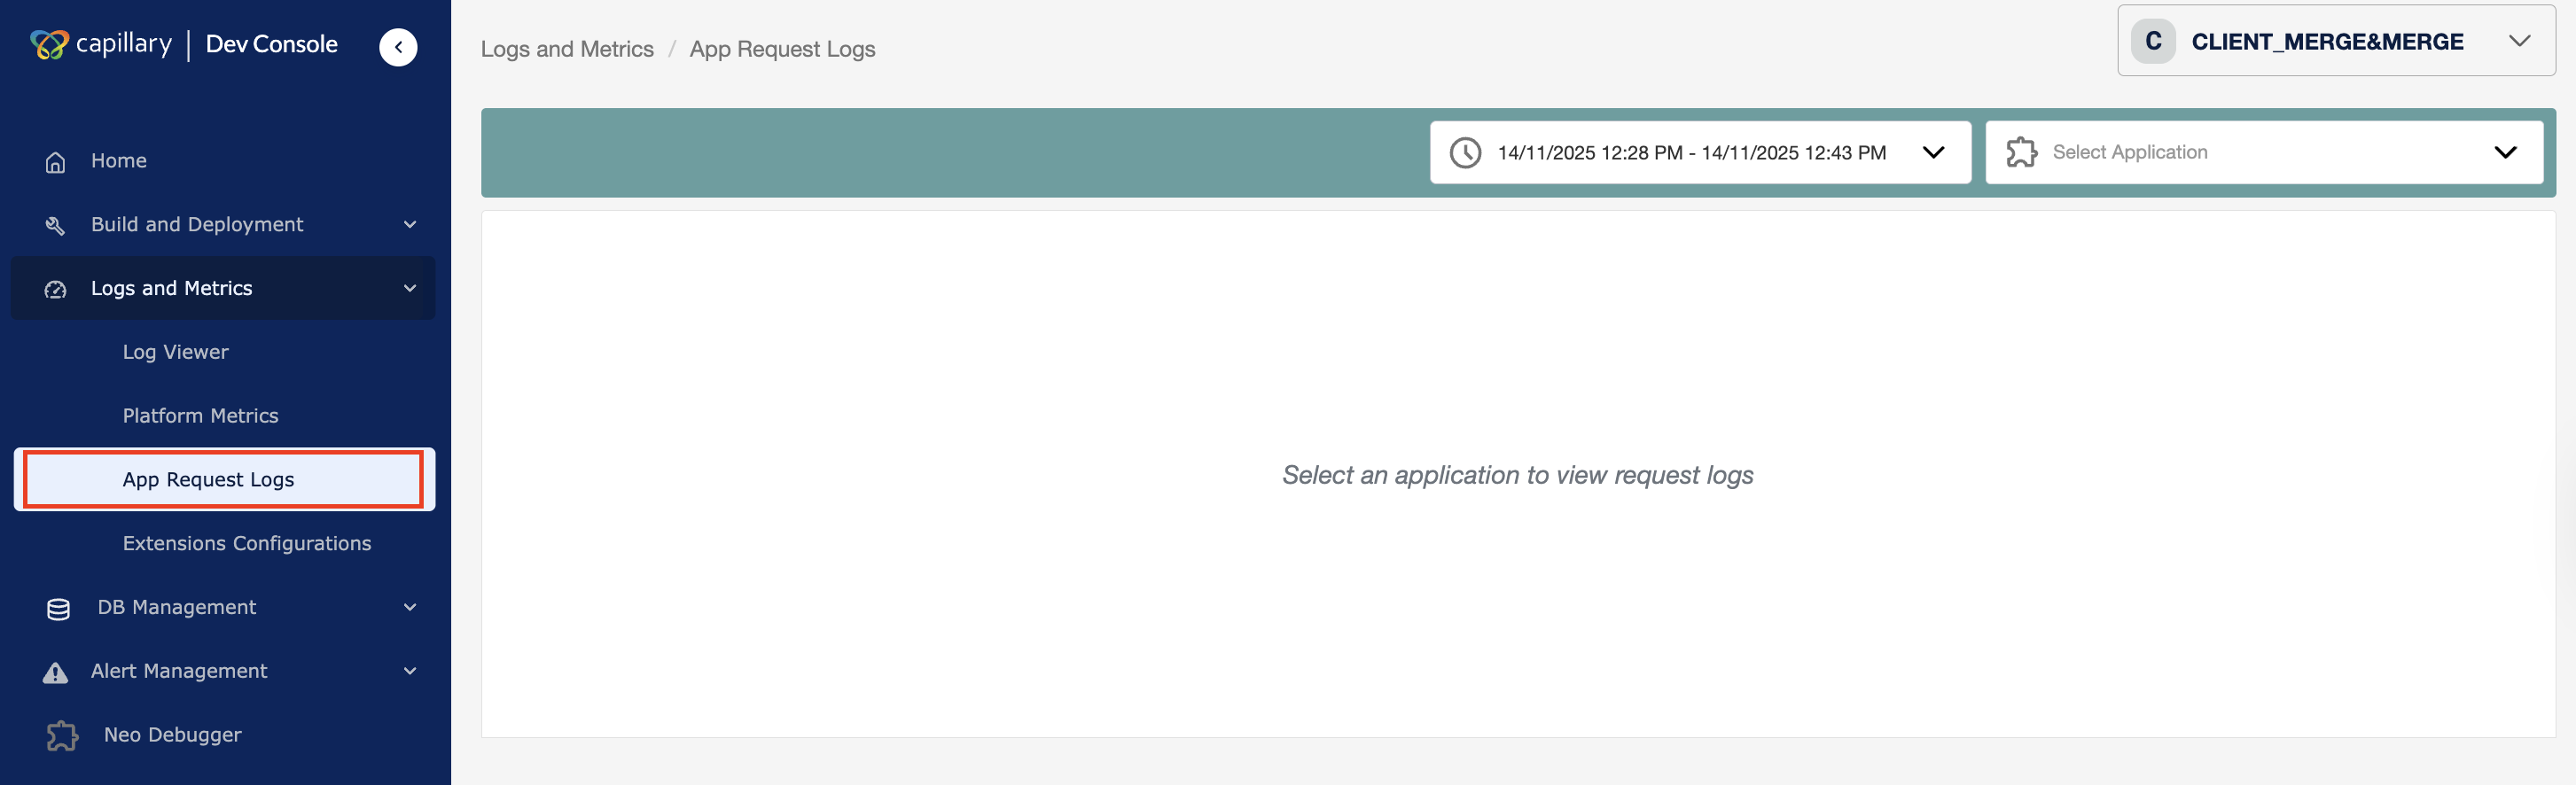
-
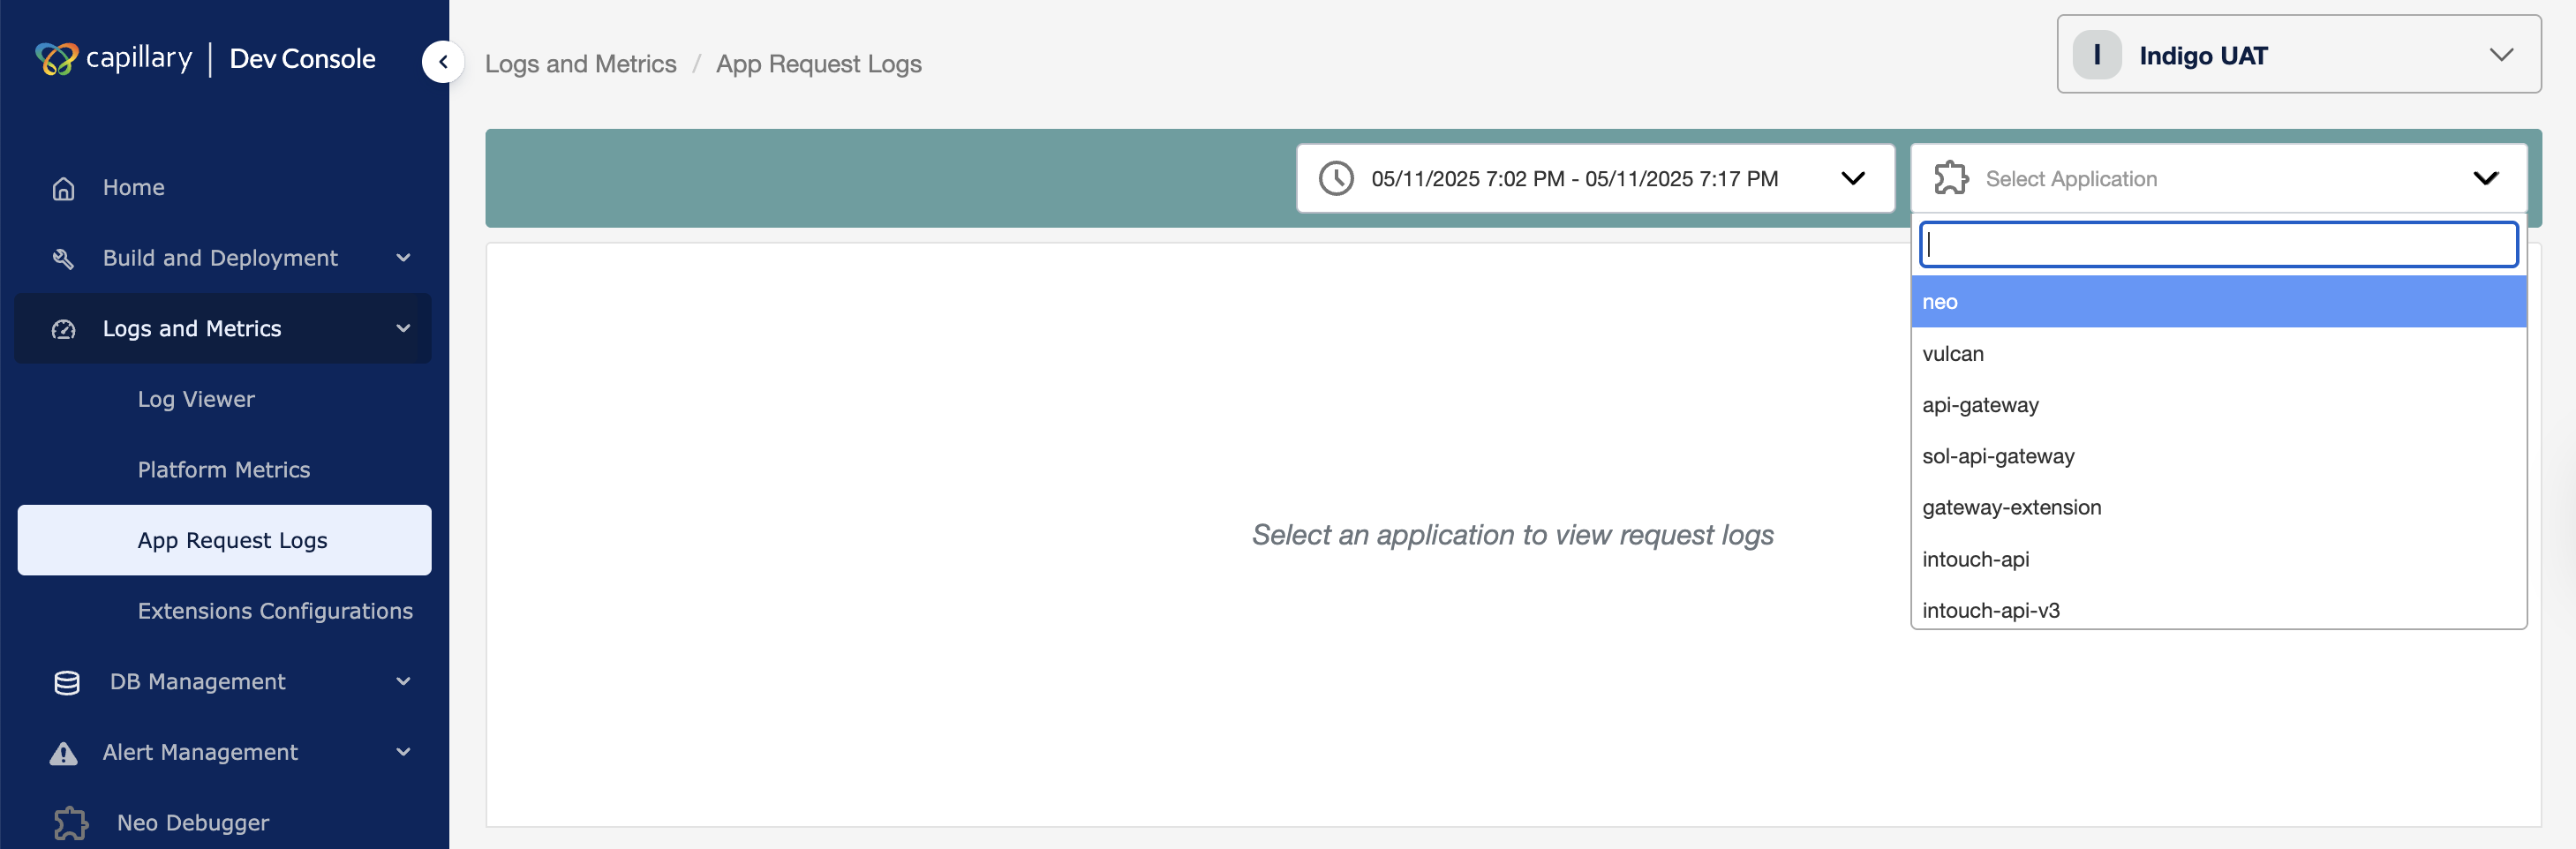
From the Select Application drop-down, choose the application you want to view.
-
(Optional) Apply filters to narrow down the results:
-
Select a filter field for the application and enter a value.
-
Choose Exact for an exact match or Like for a partial match.

-
To add more filters, use the Add filter field drop-down and click Add to include them in the filter list.
Note: There is no limit on the number of filters you can apply. -
To remove filters from the list, click ❌.
Note: You can add the filter back by selecting it again from the drop-down list.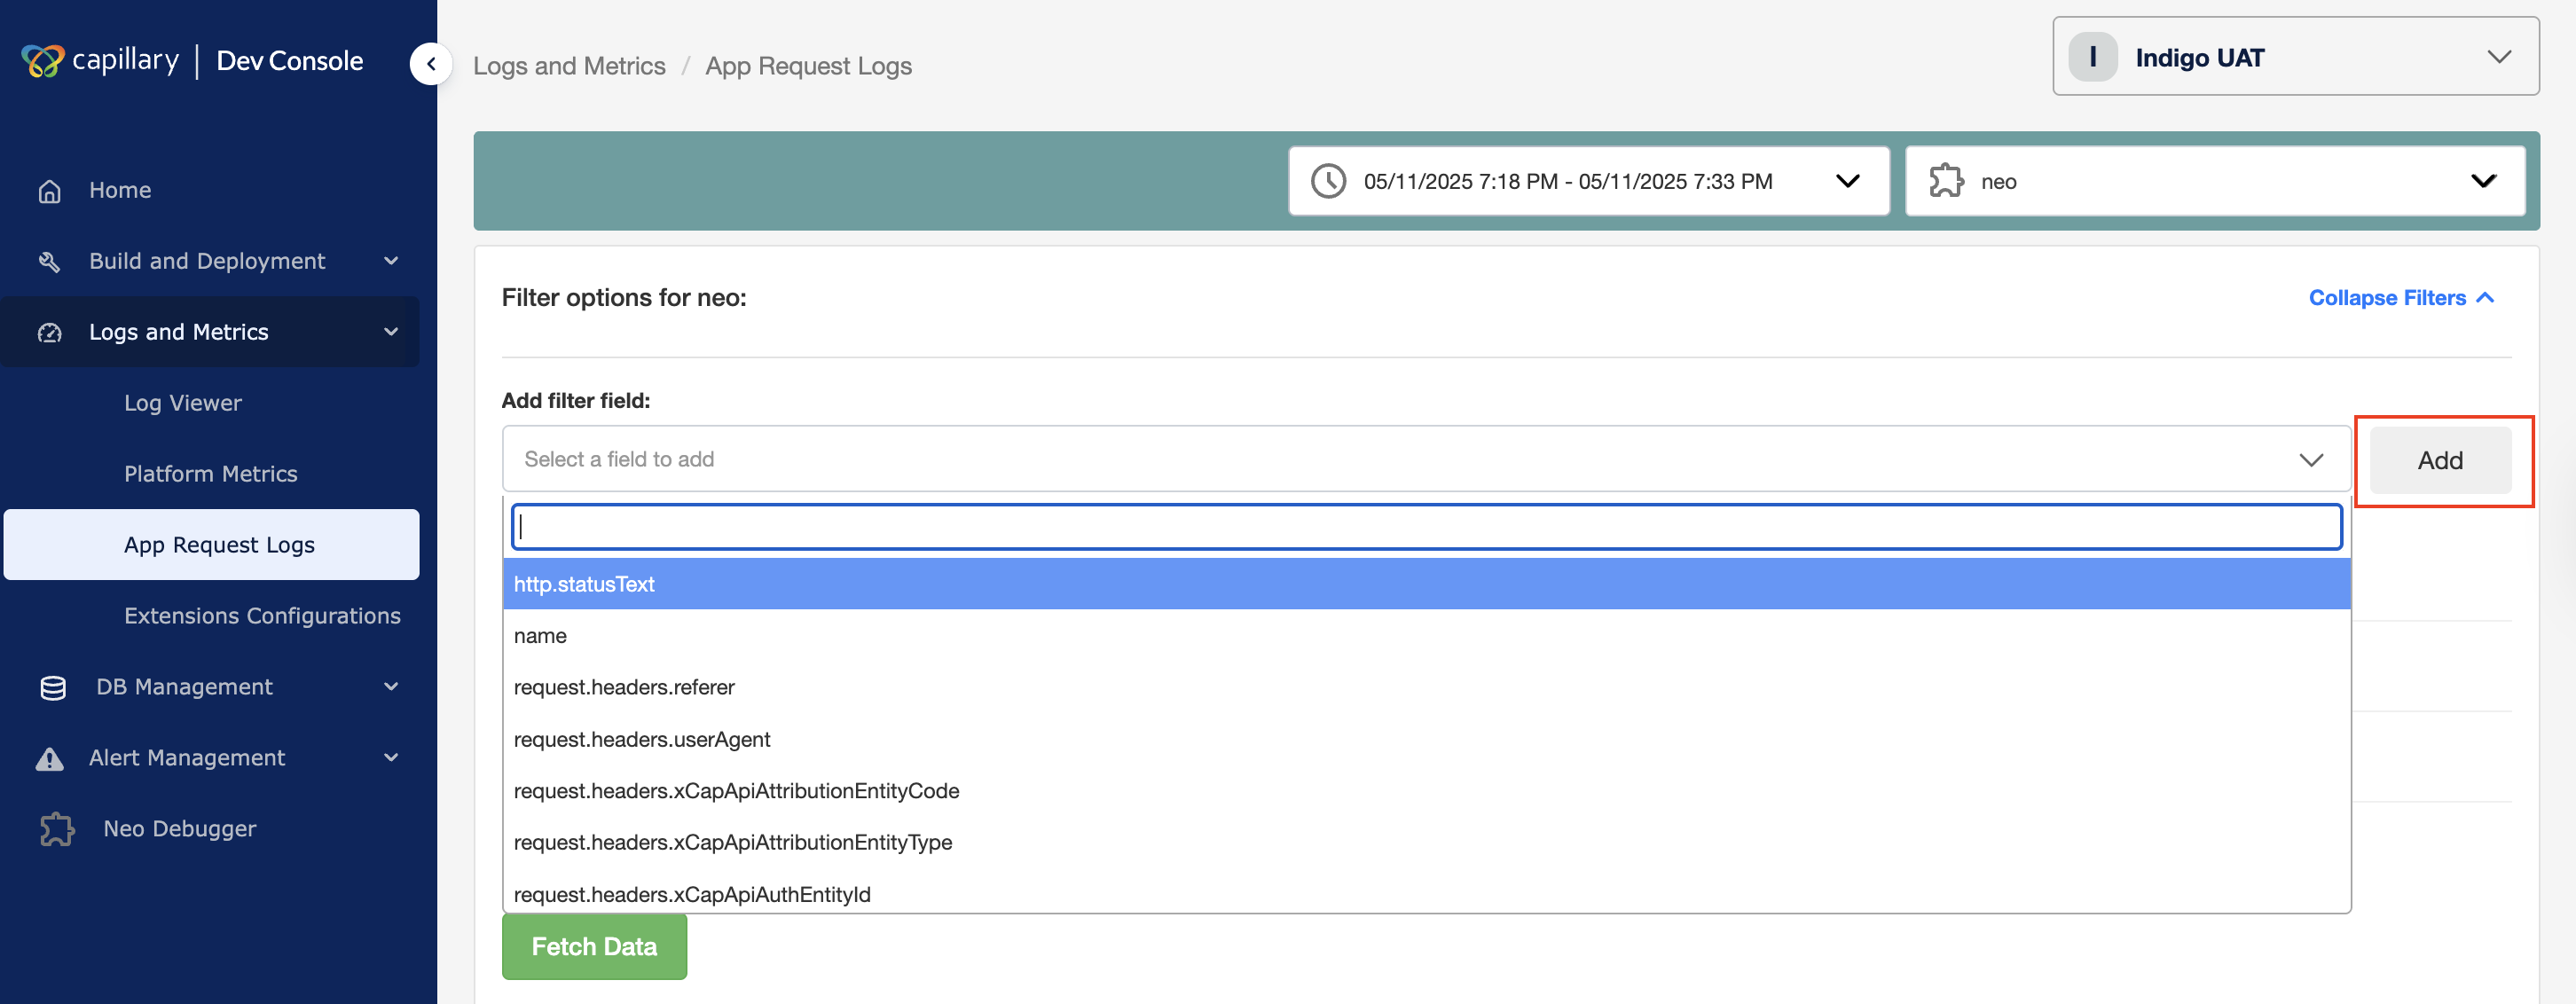
-
-
Click Fetch Data.
The logs for the selected application, time range, and filters are displayed.
You can refine the results further using filters. The next section explains how filters work and how to use them effectively.
Using filters and filtering the request logs
The App Request Logs page provides filtering options that are integrated with New Relic. The filter form supports both New Relic headers and application-specific custom fields, and the available filters vary based on the application you select. You can apply multiple filters without any limit, using either exact matches or partial matches to refine the results.
Example:
Any custom fields pushed by Neo to New Relic also appear as available filter fields on this page.
Use Cases
The main use cases for these filters include:
- Searching for specific requests
Problem:
You need to locate transactions related to a specific API endpoint, but the logs contain too many entries.
Solution:
Use the filters to narrow down the results.
-
Exact Match Search
Select Exact, and enter the full request URL to find a specific request.
Example: Searching for/api/v1/xto6x/execute/nominee-getretrieves only transactions that exactly match this request. -
Substring Search
Select Like, and enter part of the URL to find similar requests.
Example: Searching for%nominee-getretrieves all transactions containing this substring in the request URL.
2. Identifying failures and errors
Problem:
It’s difficult to identify failed requests among large volumes of log data.
Solution:
Apply filters to display only transactions that returned specific status codes (for example, 4xx for client errors or 5xx for server errors).
Usage:
-
Enter
4%in the filter field to view all transactions with status codes starting with 4 Example: 400, 401, 404. -
Enter
5%to find server error responses.
Example: 500, 502
If you are viewing logs for a Neo application, you can explore additional execution details using Neo Log Insights, as described in the next section.
Neo Log Insights
When the application type is Neo, the Fetch Data results include a clickable Request ID. Selecting this link opens the Neo Log Insights view in Platform Metrics. Neo Log Insights provides detailed visibility into the execution of a Neo dataflow, including its execution status, duration, executed blocks, and block-level input and output.
Neo Log Insights consists of five tabs that help you analyze logs, examine block execution, inspect DAO responses, and review request-level details captured from New Relic and Loki.
Tabs overview
The Neo Log Insights view includes the following tabs:
-
Raw Logs
-
Log Insights
-
Block I/O
-
Block Inspector
-
Request Details
Each tab provides a different perspective on the dataflow execution, as described below.
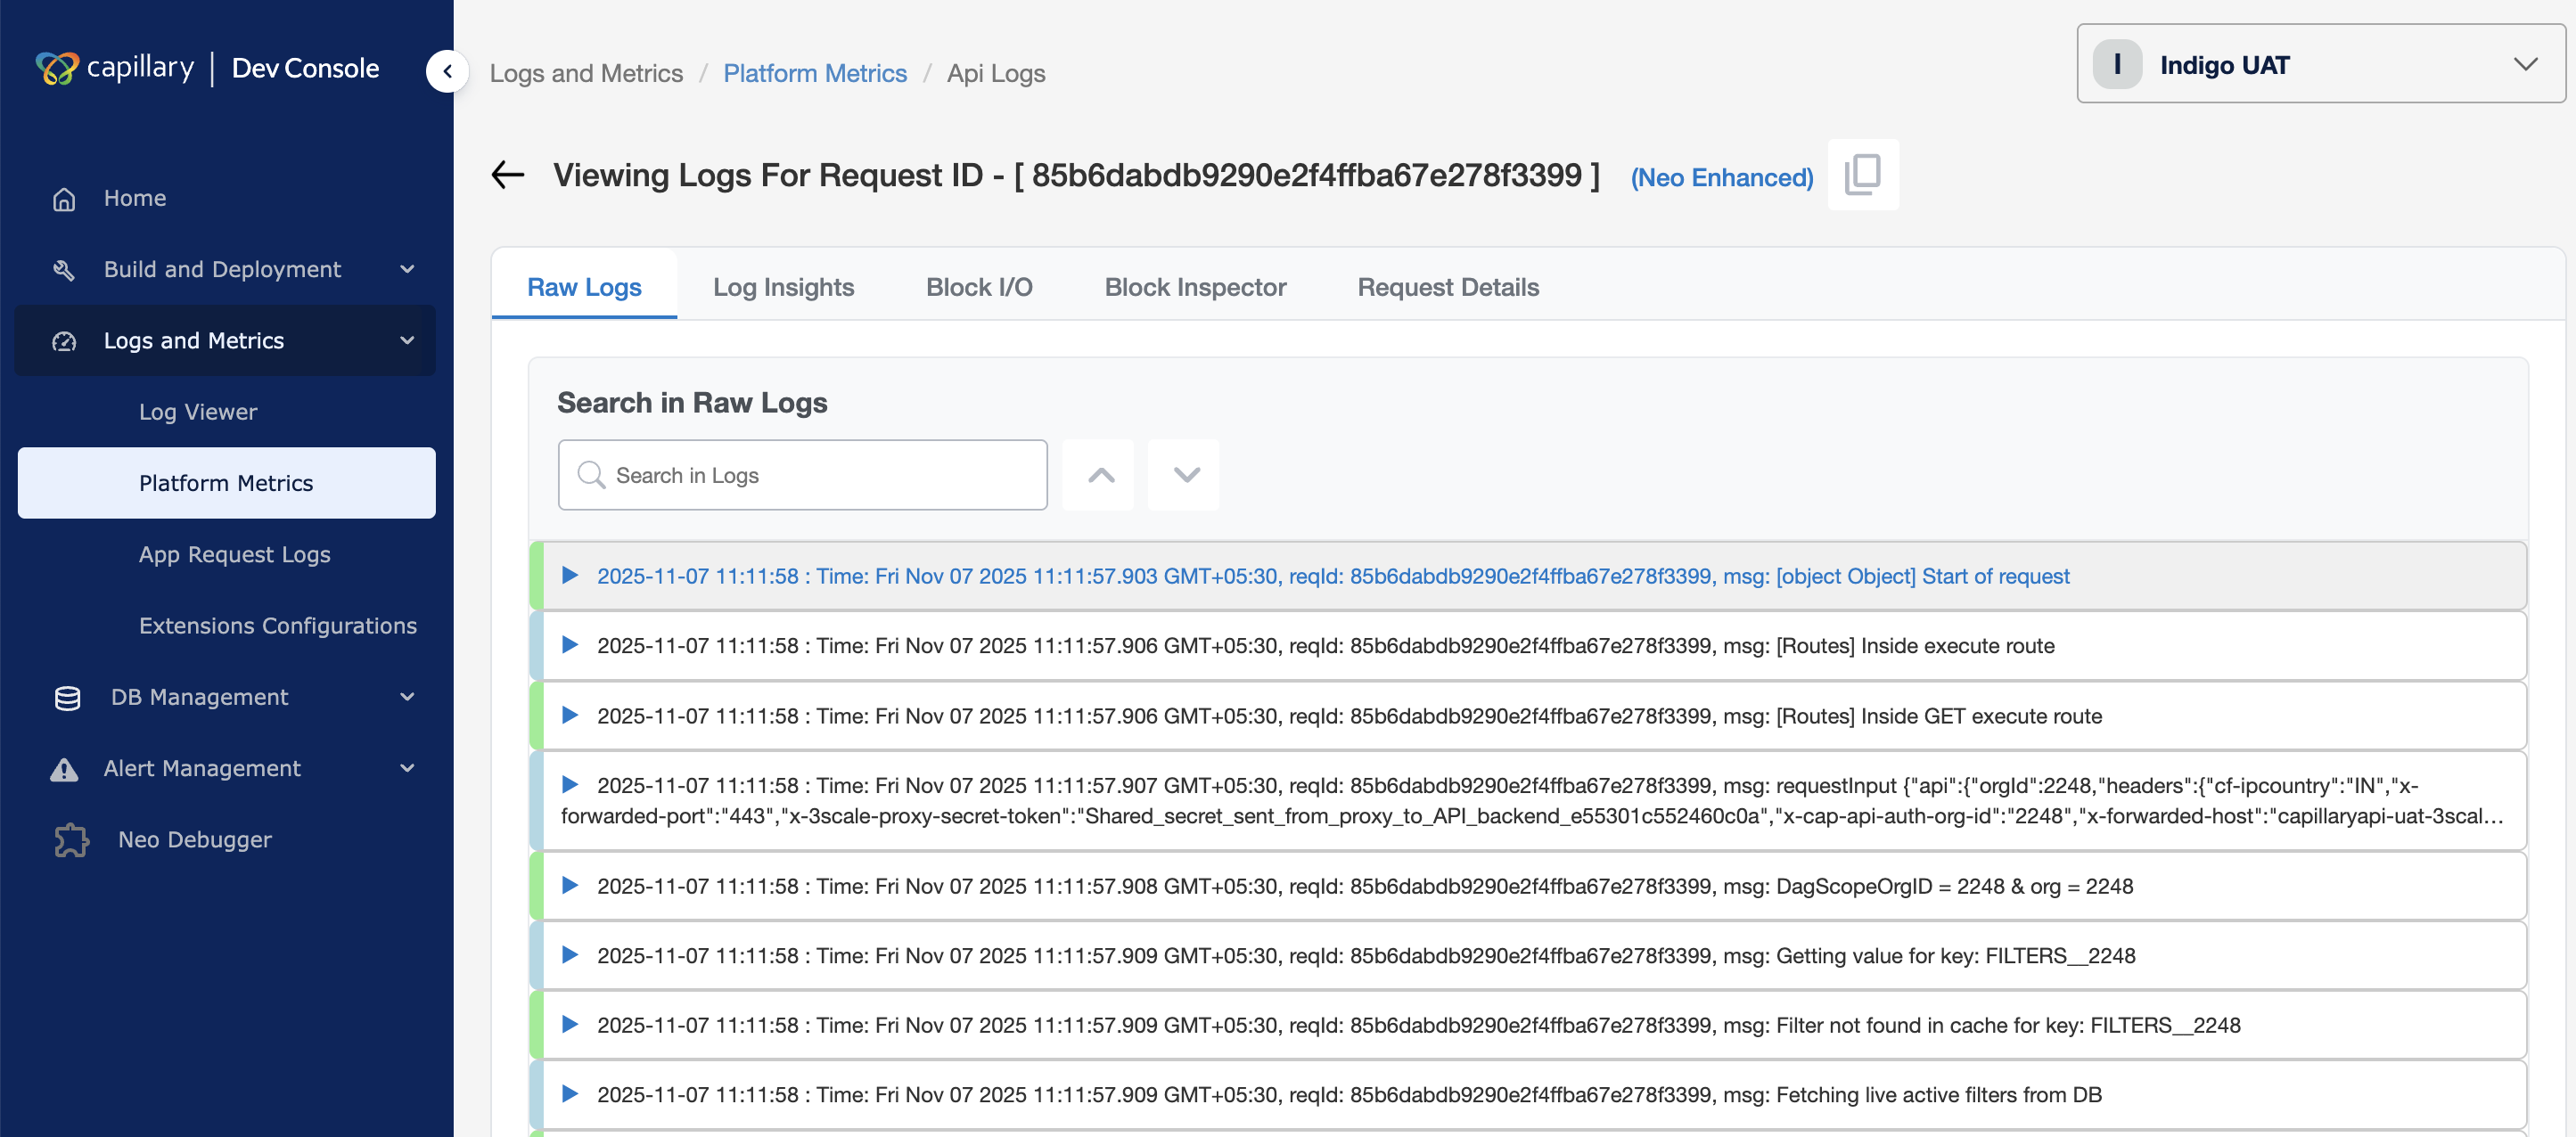
Raw Logs
The Raw Logs tab displays all logs associated with the selected Request ID. Logs are fetched directly from Loki and shown in their raw form.
-
Expand any log entry to view detailed information.
-
Use the search bar to find specific text or substrings within the log messages.
Log Insights
The Log Insights tab provides a summarized view of the dataflow execution for the specified Request ID. It includes the following sections:
-
Summary: Displays the endpoint, total time taken, and status code.
-
Errors: Lists the errors that occurred in each block during the dataflow execution.
-
Block Execution Flow: Shows the execution status of each block.
-
Timeline Breakdown: Displays when each log entry was recorded, helping identify performance issues.
Block I/O
The Block I/O tab shows the input for each block in the execution sequence. The input to a block is the output of the previous block. This tab helps you understand how data flows through the dataflow.
Block Inspector
The Block Inspector tab provides access to a set of DAO functions that retrieve specific data for a selected block.
You can use these DAO functions to fetch details such as block input, output, or execution data.
Usage
-
Select the block name from the Select Block drop-down list.
-
Type the DAO function in the input field to execute it.
Example:
-
Type
helpto list all supported DAO functions. -
Type
dao.getBody()to retrieve the body of the output response for the selected block.
Request Details
The Request Details tab displays detailed information from the New Relic transaction, including:
-
Request headers
-
Query parameters
-
Path parameters
Updated 5 months ago