
Edit, download or delete report
Download Report
To analyze a report offline, you can download a generated report to an Excel sheet. The downloaded report consists of the entire data of the report such as segment level data for each KPI and filters applied. You will also see data in different visualizations that are applied to the report (pie chart, bar chart etc).
To download a report:
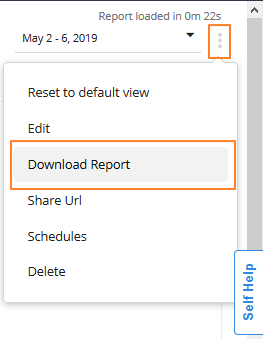
- Open the report that you want to download
- Click the More Options icon > Download Report
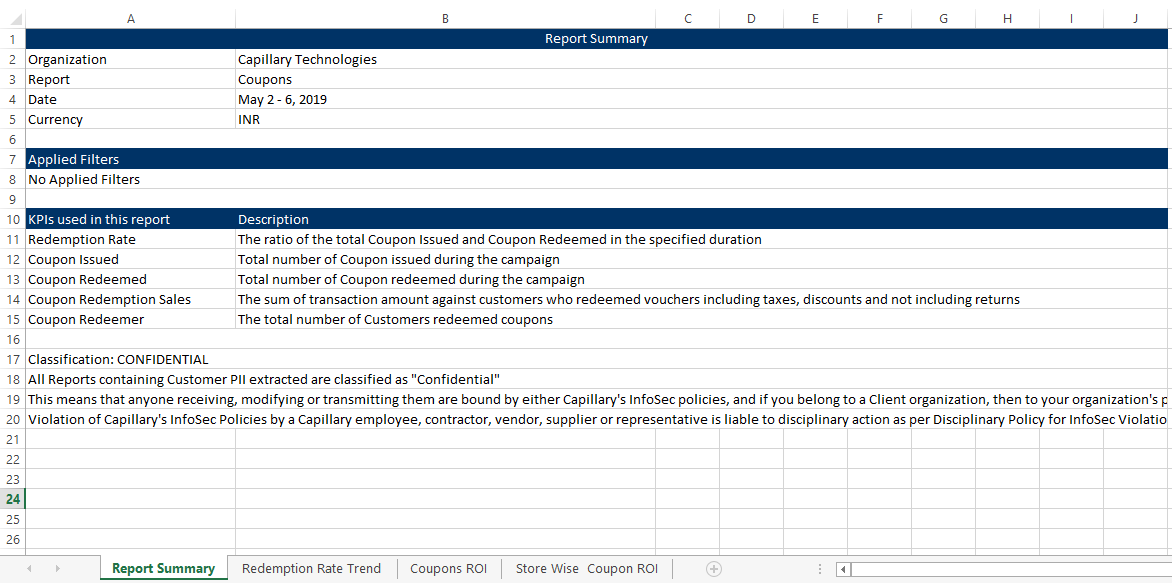
You will see the report summary in the first and data of each chart in different tabs as shown below.
The report contains the summary along with the descriptions of KPIs and Dimensions, score cards, and data of individual charts of the report.
Edit Custom Report
You can modify custom reports to change the alignment of charts, add or remove charts and alter the date range.
To edit a custom report:
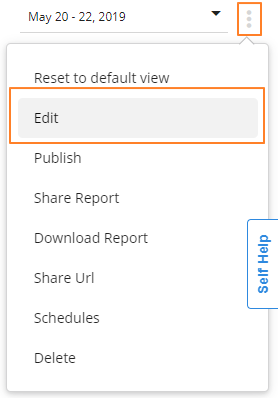
- Open the report that you want to download
- Click the More Options icon > Edit
- Click Add/Remove Charts to see the charts screen
- Click Add to add a chart and Remove to remove a chart
- Close the pop-up screen if you are done with updating charts
- To align charts, use courser to drag a chart and drop it at the desired position. For example, right, left, center, up, and down
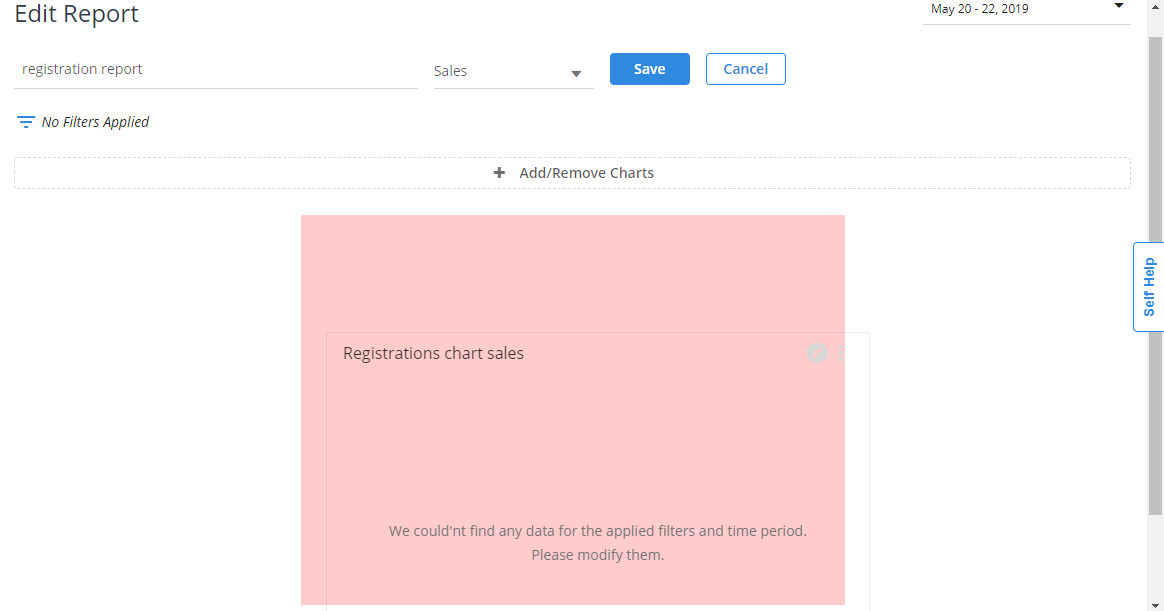
- Click Save to save your changes
Delete Custom Report
You can delete the reports that you have created and reports created by others if you have edit level access or admin access.
To delete a custom report:
- Open the report that you want to download
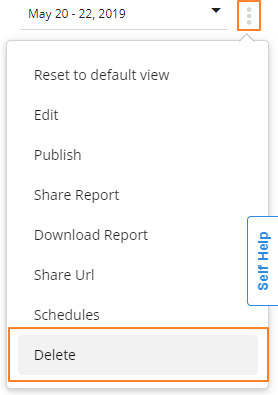
- Click the More Options icon > Delete
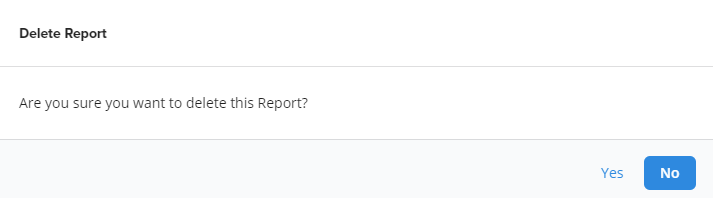
- Click Yes to confirm
Updated 6 months ago